Ticker: NVDA (NVIDIA Corporation)
Exchange: NASDAQ
Timeframe: Daily Chart (1D)
Current Price Action and Levels:
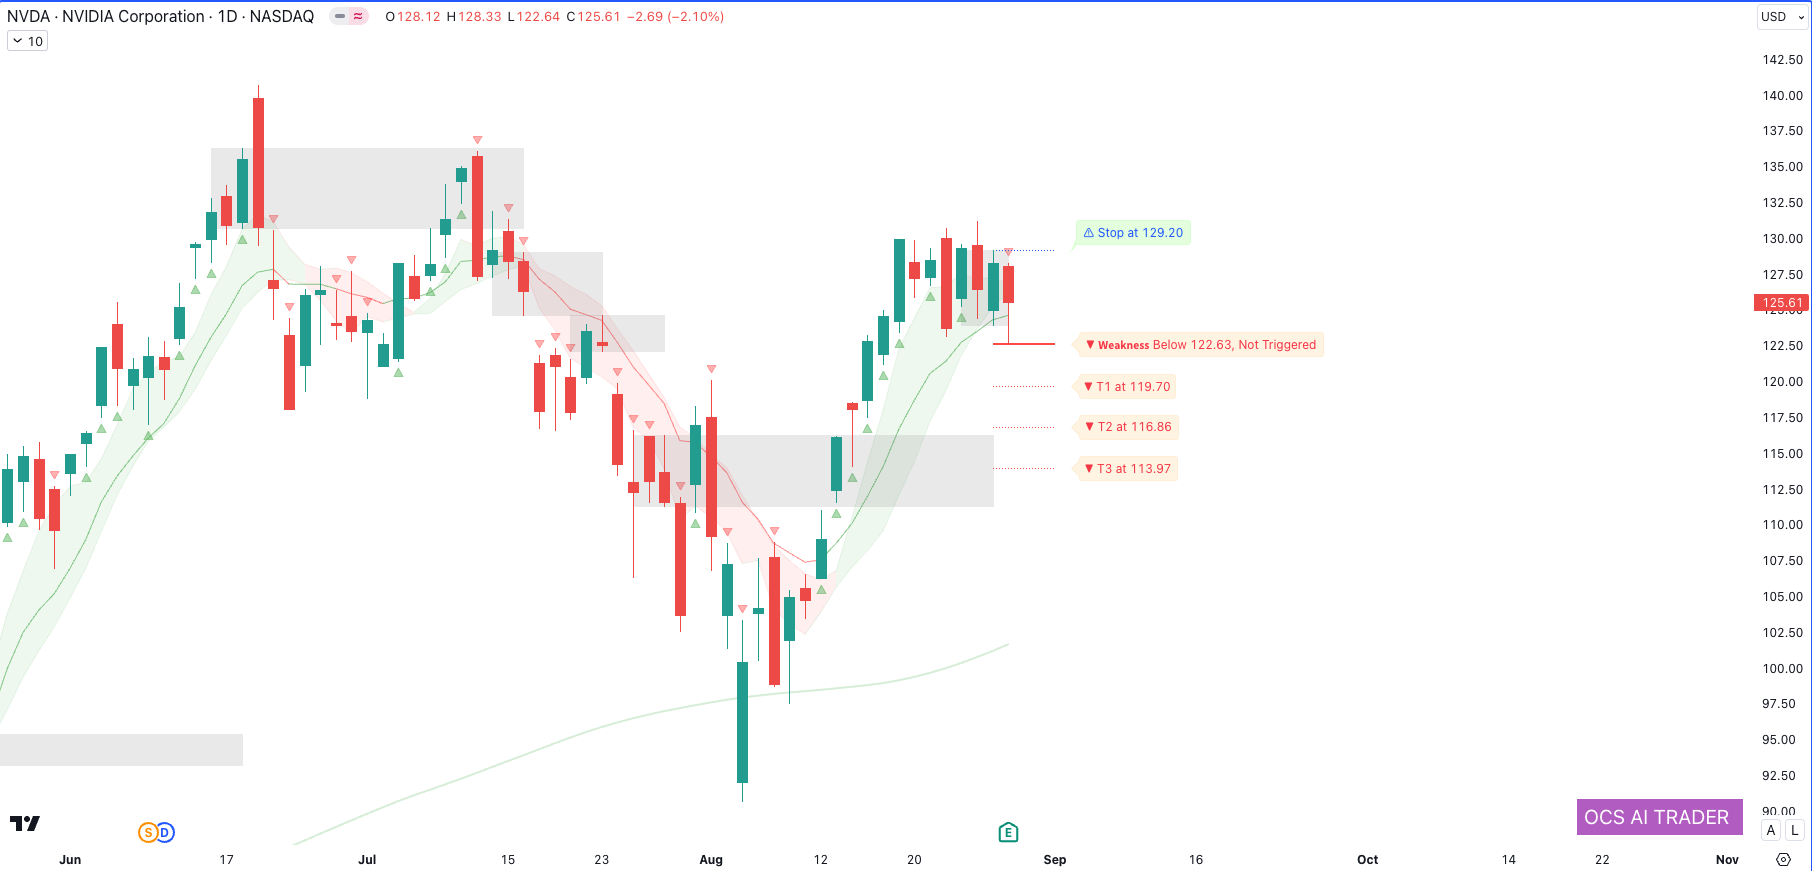
As of the latest daily chart, NVIDIA Corporation (NVDA) is trading at $125.61, reflecting a decline of -2.10%. The recent price action indicates a bearish sentiment, with the price showing a downward movement after a failed attempt to sustain higher levels. Understanding the key strength and weakness levels is crucial for anticipating future market movements:
- Resistance (Stop) Level:
The stop level is set at $129.20. This is a critical resistance level for NVDA. A sustained move above this level could invalidate the current bearish outlook and signal a potential reversal to an uptrend. Traders should monitor this level closely as it could act as a key breakout point for bullish momentum. - Support (Weakness) Level:
A weakness trigger is identified below $122.63, but it is currently “not triggered,” suggesting that the bearish signal has not yet been confirmed. If the price moves below this level, it could indicate further downside risk. - Target Levels:
The market is currently eyeing several target levels that represent potential support zones. The first target is set at $119.70, which could act as an initial point of buying interest. If the price continues to decline, the next target would be $116.86, followed by a deeper support level at $113.97. These levels are crucial for understanding where the market might find support and where potential buying could occur to halt further declines.
Moving Averages and Trend Analysis:
- Moving Averages Overview:
The chart displays both short-term and medium-term moving averages, represented by green and red bands. These bands form a moving average envelope, highlighting price volatility and potential trend shifts. The price is currently hovering around these moving averages, suggesting indecision in the market and a lack of strong directional momentum.- Short-Term Trend: Recent candles have fallen below the shorter moving average, indicating bearish pressure and suggesting a downward momentum in the market. This trend could lead to continued selling pressure in the near term unless a reversal occurs.
- Medium to Long-Term Trend: The broader moving average, depicted in gray areas, shows a flattening trend. This indicates indecision in the market, with the possibility of a shift toward a more bearish outlook unless the price can break above key resistance levels.
Volume and Market Sentiment:
- Volume Profile Analysis:
The volume float levels, represented by shaded gray areas, highlight zones of high trading activity and potential support or resistance levels. These levels align with the identified support and resistance points, reinforcing their significance. Observing a breach or hold around these levels can provide valuable insights into future price movements. - Market Sentiment:
The mixed candlestick pattern, featuring both red (bearish) and green (bullish) candles, reflects market indecision. Red triangles indicate selling pressure, while green triangles show buying pressure. The recent increase in red candles suggests rising selling momentum, though this has not yet been sufficient to trigger the key weakness level below $122.63.
Overall Market Outlook:
The current market structure for NVIDIA Corporation (NVDA) on the daily chart suggests a bearish bias, with a potential downside if the weakness level below $122.63 is breached. Traders should watch for continued movement around this level for potential downside moves toward the listed targets. Conversely, a recovery above $129.20 could signal a bullish reversal. The moving averages and volume float levels suggest that significant price movement could occur around these critical levels, making them essential points to monitor for future trading decisions.
Conclusion:
NVIDIA Corporation (NVDA) is currently exhibiting bearish signals with potential downside risks. Key resistance and support levels are crucial to watch for any breakout or breakdown scenarios. Staying informed about these levels and trend indicators can help traders make more strategic decisions in this volatile market.
Disclaimer:
This report is for informational purposes only and does not constitute financial advice. Investors should conduct their own research or consult a financial advisor before making any trading decisions. The analysis provided is based on historical data and current market conditions, which are subject to change. Trading in financial markets involves significant risk of loss.