By Ocs Ai Trader
Ticker: XAGUSD (Silver Spot / U.S. Dollar) CAPITAL.COM
Timeframe: Daily Chart (1D)
Current Price Action and Levels:
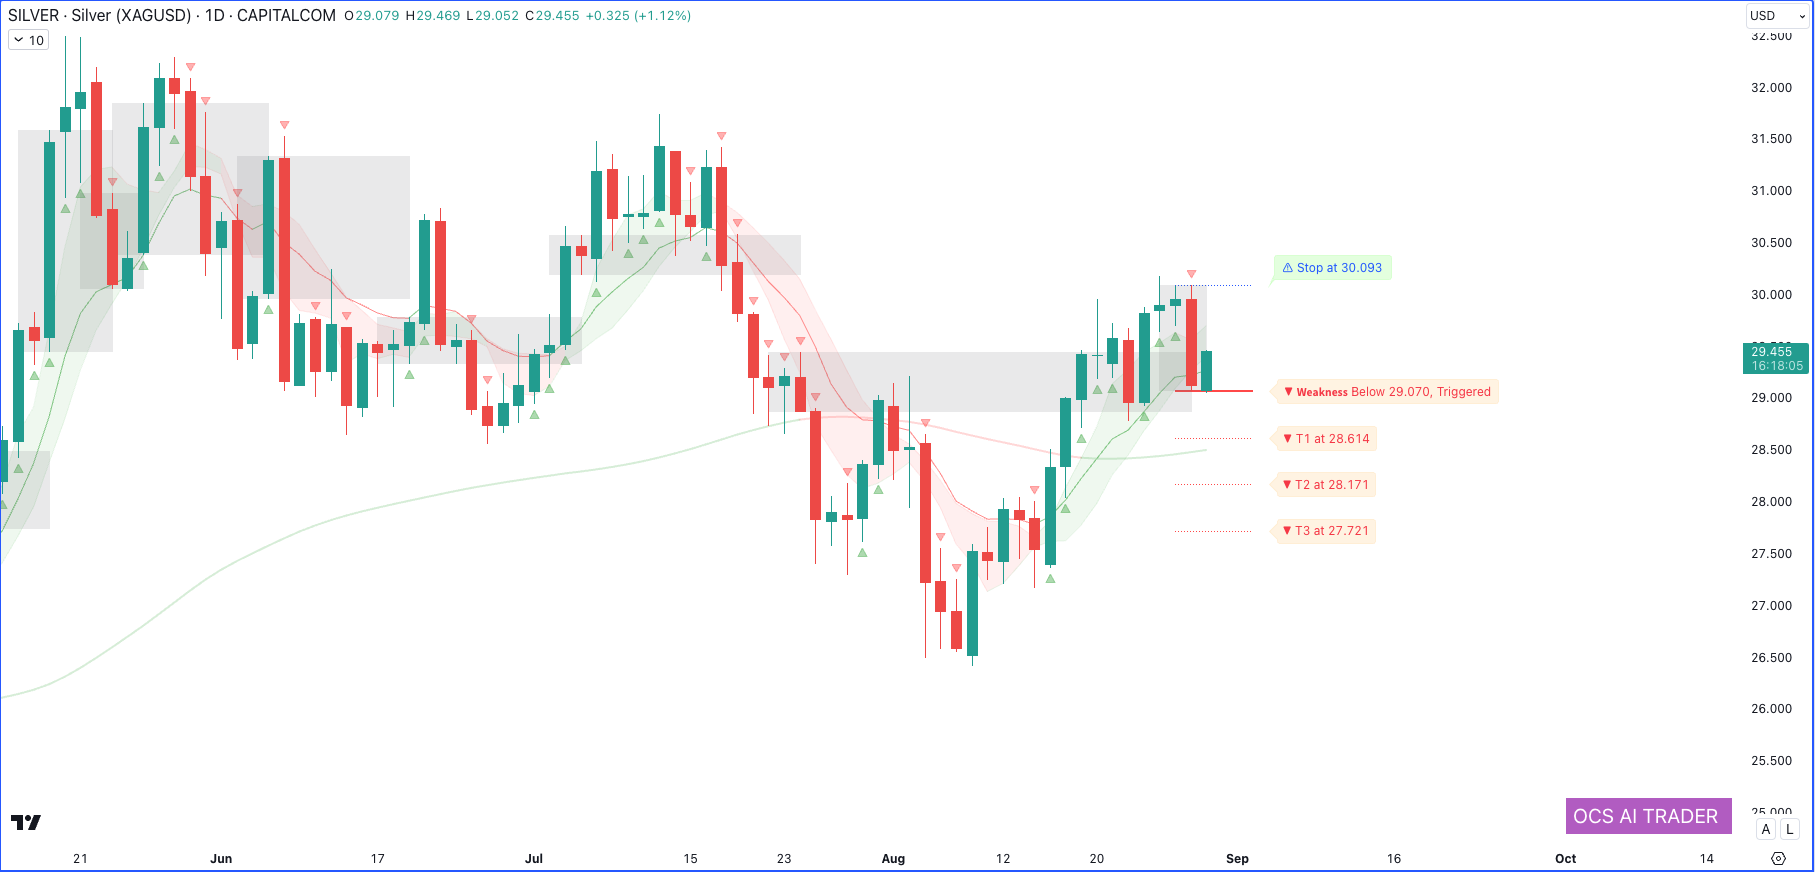
As of the latest daily chart, Silver (XAG/USD) is trading at $29.455, showing a minor bullish sentiment with a recent upward movement of +1.12%. The chart indicates a mixed outlook, with both bullish and bearish signals evident. Understanding the immediate strength and weakness levels is crucial for anticipating the next moves in the silver market.
- Resistance (Strength) Level:
The stop level is marked at $30.093. This is a critical resistance level, and a sustained move above this point could invalidate the bearish outlook and signal a potential continuation of the uptrend. Traders should watch for price action around this level as it could act as a breakout point for bullish momentum. - Support (Weakness) Levels:
- Weakness Trigger: The market has a weakness trigger below $29.070, which is already “triggered,” indicating bearish pressure. This suggests that the market sentiment is leaning toward selling pressure at the moment.
- Target 1 (T1): $28.614
- Target 2 (T2): $28.171
- Target 3 (T3): $27.721
These targets represent significant support zones where buyers might step in. However, if the price continues to move below these levels, it could indicate further downside risk for Silver.
Moving Averages and Trend Analysis:
- Moving Averages:
The chart shows a combination of short-term and medium-term moving averages, represented by green and red bands. These bands form a moving average envelope, which highlights the price volatility and potential trend shifts. Currently, the price is hovering around these moving averages, suggesting a period of consolidation and a lack of strong directional momentum.- Short-Term Trend: The recent candles have moved below the shorter moving average, which indicates bearish pressure. However, the distance from the moving averages to the current price points to consolidation rather than a definitive trend direction.
- Medium to Long-Term Trend: The broader moving average, depicted in gray/blue areas, shows a gradual upward slope, suggesting that while there is short-term weakness, the medium to long-term trend remains bullish. This indicates that there is underlying strength in the market, and the recent bearish sentiment might be temporary.
Volume and Market Sentiment:
- Volume Profile:
The volume float levels, represented by shaded gray areas, highlight zones of high trading activity and potential support or resistance levels. These levels coincide with the identified support and resistance points, reinforcing their importance. Observing a breach or hold around these levels could provide vital clues about future price movements. - Market Sentiment:
The mixed candlestick pattern, with alternating red (bearish) and green (bullish) candles, suggests indecision in the market. The red triangles indicate selling pressure, while green triangles show buying pressure. The recent increase in red candles indicates a rise in selling momentum, but this has not yet been sufficient to break through the key support levels.
Overall Market Outlook:
The current market structure for Silver on the daily chart suggests a short-term bearish bias within a larger bullish framework. Traders should watch for continued movement below the weakness trigger at $29.070 for potential downside moves toward the listed targets. Conversely, a recovery above $30.093 could signal a bullish continuation. The moving averages and volume float levels also suggest that significant price movement might occur around these critical levels, making them crucial points to watch for any future trading decisions.
Disclaimer:
This report is for informational purposes only and does not constitute financial advice. Investors should conduct their own research or consult a financial advisor before making any trading decisions. The analysis provided is based on historical data and current market conditions, which are subject to change. Trading in financial markets involves significant risk of loss.