Ticker: NQ1! (NASDAQ 100 E-mini Futures)
Exchange: CME (Chicago Mercantile Exchange)
Timeframe: Daily Chart (1D)
Current Price Action and Levels:
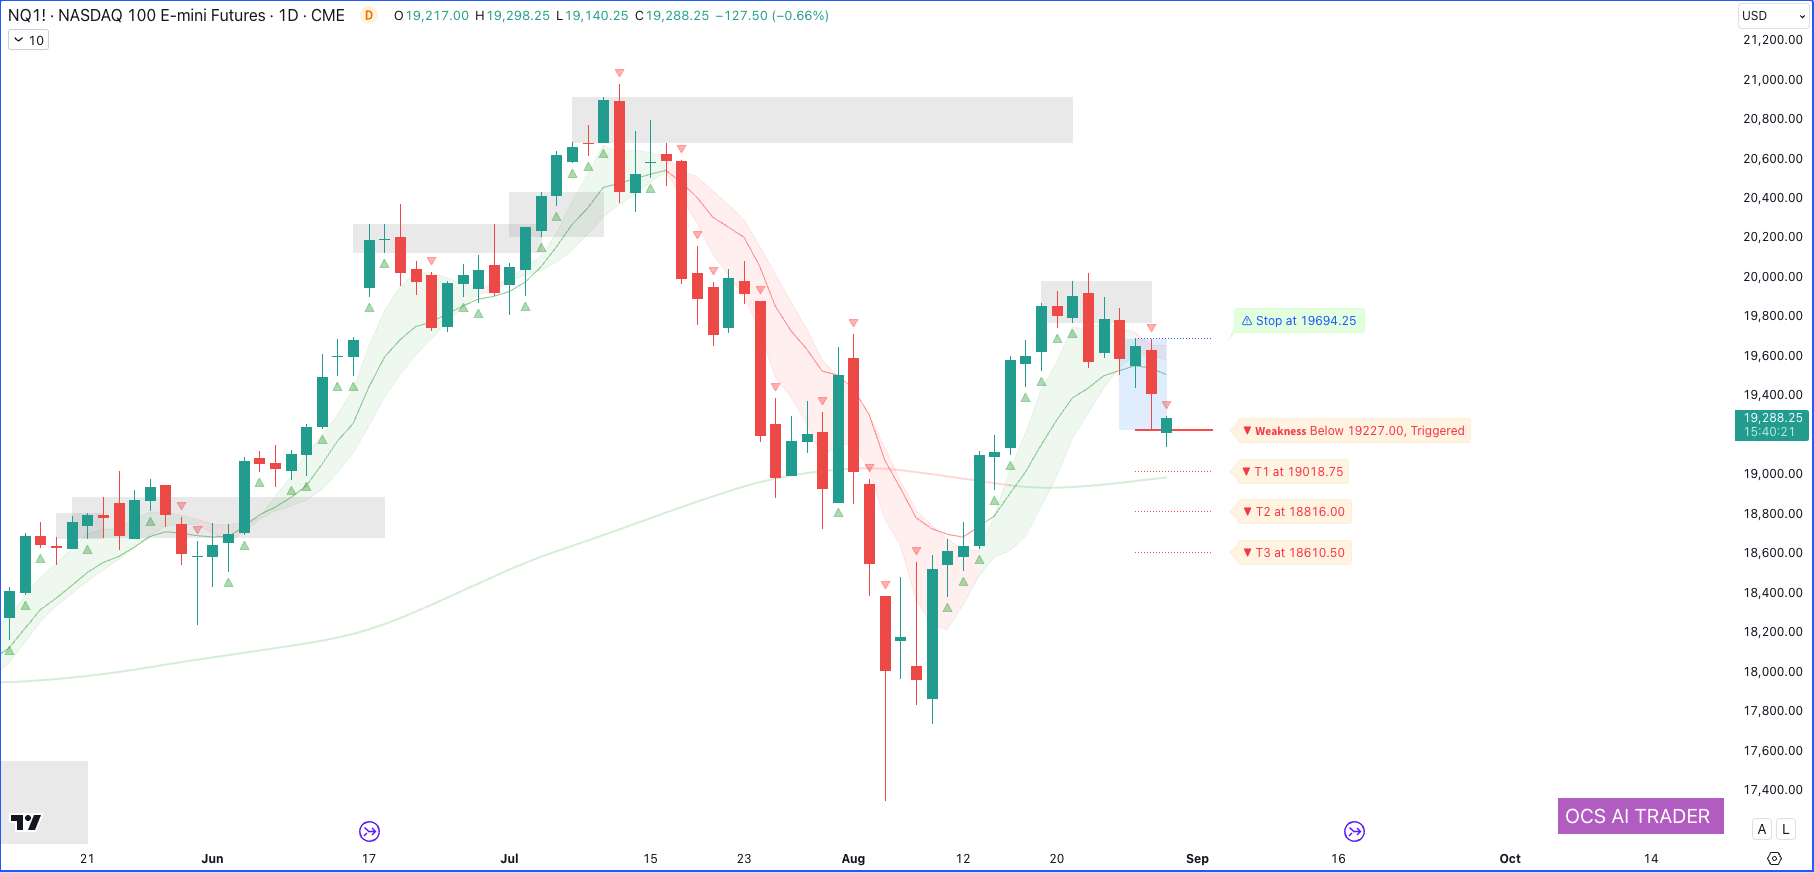
As of the latest daily chart, NASDAQ 100 E-mini Futures (NQ1!) are trading at $19,288.25, with a decline of -0.66%. The current market sentiment shows a mix of both bullish and bearish indicators, signaling potential volatility. Understanding the key levels of strength and weakness is essential for anticipating future market movements.
- Resistance (Strength) Level:
The stop level is marked at $19,694.25. This is a critical resistance point. If the price sustains above this level, it could invalidate the current bearish outlook and indicate a possible continuation of the uptrend. Traders should monitor this level closely as it could act as a breakout point for bullish momentum. - Support (Weakness) Levels:
- Weakness Trigger: The weakness trigger below $19,227.00 has been “triggered,” indicating bearish pressure. This suggests the market is currently inclined towards selling.
- Target 1 (T1): $19,018.75
- Target 2 (T2): $18,816.00
- Target 3 (T3): $18,610.50
These targets are significant support zones where buyers might step in. However, if the price falls below these levels, it could indicate further downside risk for NASDAQ 100 E-mini Futures.
Moving Averages and Trend Analysis:
- Moving Averages:
The chart displays both short-term and medium-term moving averages, represented by green and red bands. These bands form a moving average envelope, reflecting price volatility and potential trend shifts. The price is currently hovering around these moving averages, suggesting a period of consolidation with no strong directional momentum.- Short-Term Trend: Recent candles below the shorter moving average indicate bearish pressure, suggesting downward momentum in the market. This could lead to continued selling pressure in the short term.
- Medium to Long-Term Trend: The broader moving average, depicted in gray/blue areas, shows a flattening trend, suggesting indecision in the market. Although there was a previous bullish trend, the current flattening indicates a potential shift toward a more neutral or bearish outlook unless there is a significant move above key resistance levels.
Volume and Market Sentiment:
- Volume Profile Analysis:
The volume float levels, represented by shaded gray areas, highlight zones of high trading activity and potential support or resistance levels. These levels coincide with the identified support and resistance points, reinforcing their significance. Observing a breach or hold around these levels can provide vital clues about future price movements. - Market Sentiment:
The mixed candlestick pattern, featuring both red (bearish) and green (bullish) candles, reflects market indecision. Red triangles represent selling pressure, while green triangles indicate buying pressure. The recent increase in red candles suggests rising selling momentum, although this has not been enough to break the next key support level.
Overall Market Outlook:
The current market structure for NASDAQ 100 E-mini Futures on the daily chart suggests a short-term bearish bias within a broader neutral to bearish framework. Traders should watch for continued movement below the weakness trigger at $19,227.00 for potential downside moves toward the listed targets. Conversely, a recovery above $19,694.25 could signal a bullish continuation. The moving averages and volume float levels also suggest that significant price movement could occur around these critical levels, making them essential points to monitor for future trading decisions.
Conclusion:
The NASDAQ 100 E-mini Futures are currently in a consolidation phase with potential downside risks. Key resistance and support levels are crucial to watch for any breakout or breakdown scenarios. Staying informed about these levels and trend indicators can help traders make more strategic decisions in this volatile market.
Disclaimer:
This report is for informational purposes only and does not constitute financial advice. Investors should conduct their own research or consult a financial advisor before making any trading decisions. The analysis provided is based on historical data and current market conditions, which are subject to change. Trading in financial markets involves significant risk of loss.