Ticker: XAUUSD (Gold Spot / U.S. Dollar)
Exchange: OANDA
Timeframe: 8-hour Chart
Current Price Action and Levels:
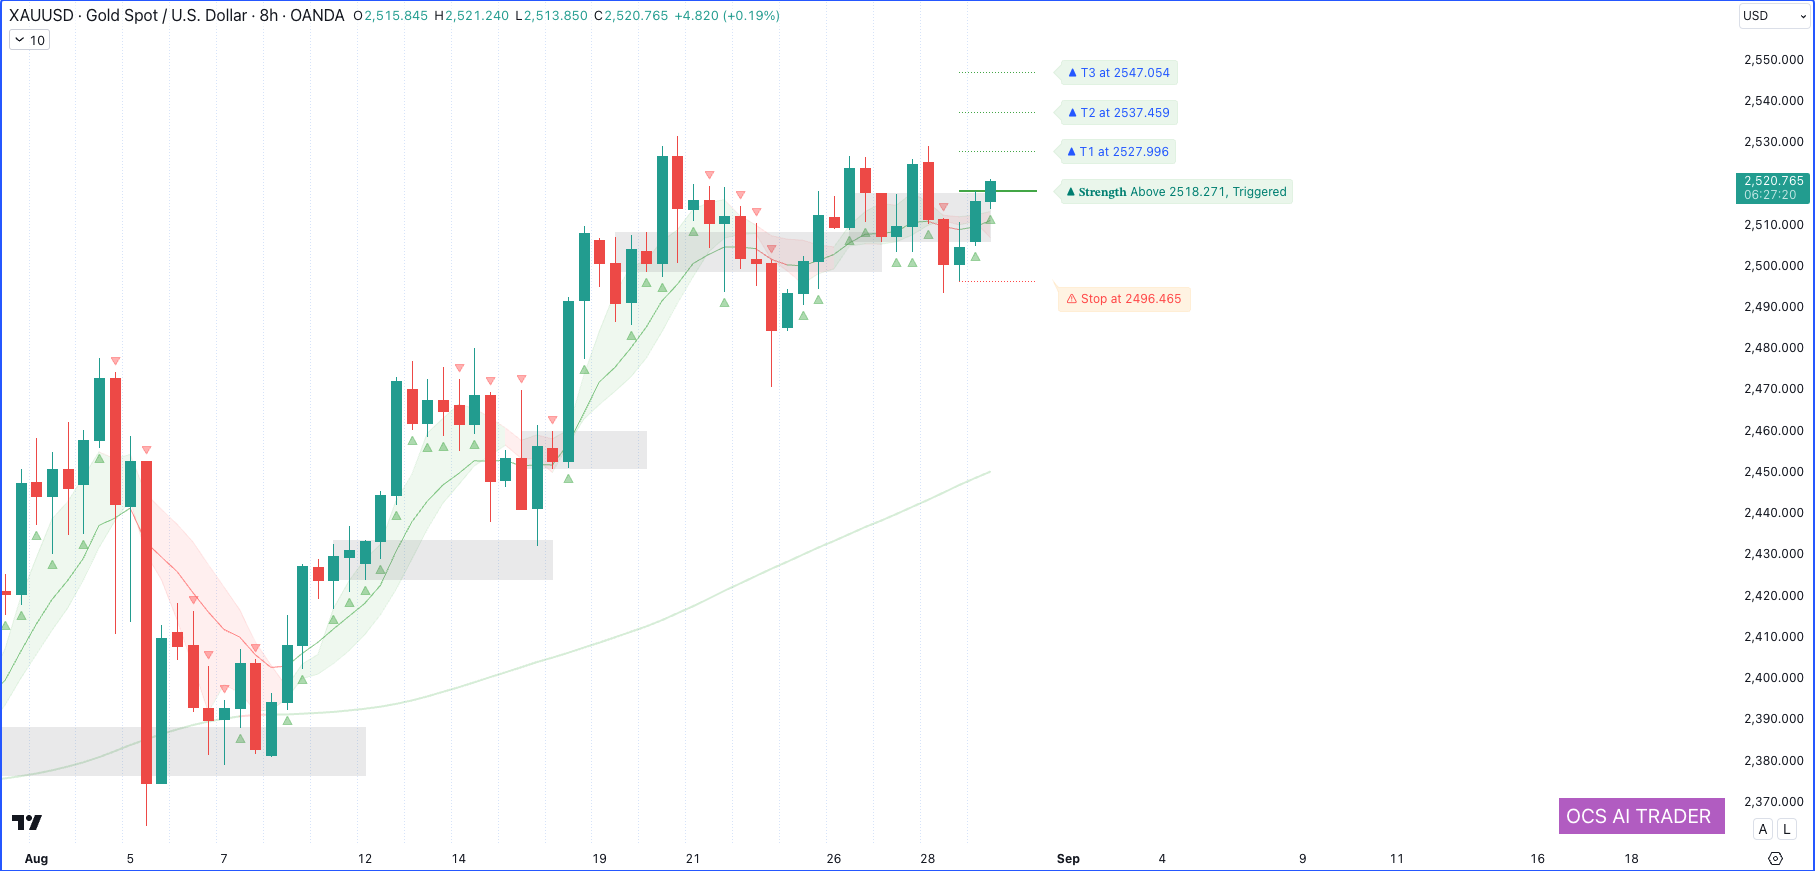
As of the latest 8-hour chart, Gold (XAU/USD) is trading at $2,520.765, reflecting a modest increase of +0.19%. The market sentiment has shifted towards a bullish outlook, with the latest price movement triggering a strength signal. Understanding the immediate strength and weakness levels is essential for anticipating future market movements:
- Strength (Resistance) Level:
The strength level has been triggered above $2,518.271, indicating a bullish sentiment. If the price continues to sustain above this level, it could signal a continuation of the uptrend. This is a crucial point for traders looking to capitalize on potential upward momentum. - Target Levels:
- Target 1 (T1): $2,527.996
- Target 2 (T2): $2,537.459
- Target 3 (T3): $2,547.054
These targets represent potential resistance zones where selling pressure could emerge. However, if the price breaks through these levels, it could indicate further upside potential for Gold.
- Support (Weakness) Level:
The stop level is marked at $2,496.465. This is a critical support level. A drop below this point could invalidate the current bullish outlook and signal a potential shift towards bearish momentum.
Moving Averages and Trend Analysis:
- Moving Averages Overview:
The chart displays a combination of short-term and medium-term moving averages, represented by green and red bands. These bands form a moving average envelope, reflecting price volatility and potential trend shifts. The price is currently hovering above the moving averages, suggesting strong bullish momentum.- Short-Term Trend: The recent candles above the shorter moving average indicate bullish pressure. This suggests that there is currently upward momentum in the market, and Gold could continue to experience buying pressure in the short term.
- Medium to Long-Term Trend: The broader moving average, depicted in gray/blue areas, shows an upward slope, reinforcing a bullish outlook. The sustained movement above these moving averages suggests that the medium to long-term trend remains positive, with potential for further gains.
Volume and Market Sentiment:
- Volume Profile Analysis:
The volume float levels, represented by shaded gray areas, highlight zones of high trading activity and potential support or resistance levels. These levels coincide with the identified support and resistance points, reinforcing their importance. Observing a breach or hold around these levels can provide critical insights into future price movements. - Market Sentiment:
The mixed candlestick pattern, with green (bullish) and red (bearish) candles, indicates a shift towards a bullish sentiment. The recent increase in green candles suggests rising buying momentum, supporting the bullish outlook and the potential for higher prices.
Overall Market Outlook:
The current market structure for Gold on the 8-hour chart suggests a bullish bias, with the strength trigger above $2,518.271 signaling potential upside momentum. Traders should monitor the movement above this level for potential continuation towards the target levels. Conversely, a move below the stop level at $2,496.465 could suggest a shift towards a bearish outlook. The moving averages and volume float levels suggest that significant price movements could occur around these critical thresholds, making them essential points to monitor for future trading decisions.
Conclusion:
Gold is currently exhibiting a bullish trend with potential upside opportunities. Key resistance and support levels are crucial to watch for any breakout or breakdown scenarios. Staying informed about these levels and trend indicators can help traders make more strategic decisions in this evolving market.
Disclaimer:
This report is for informational purposes only and does not constitute financial advice. Investors should conduct their own research or consult a financial advisor before making any trading decisions. The analysis provided is based on historical data and current market conditions, which are subject to change. Trading in financial markets involves significant risk of loss.