The $87k Liquidity Trap: Regulatory Friction and the Great Crypto Deleveraging
Executive summary
The digital asset market is currently caught in a structural liquidity trap. Bitcoin (BTC) is testing a formidable resistance level at $87,300, a point where technical exhaustion meets a burgeoning regulatory crisis. The community banking sector’s lawsuit against the OCC’s crypto-trust charters has introduced a "regulatory risk premium" that is actively forcing institutional capital to pause, re-evaluate, or pivot toward traditional, regulated financial instruments. This report traces the cascading impact of this friction: from the immediate liquidity squeeze at $87k, through the rotation out of crypto-native equities (COIN, MSTR), and into a macro-contagion loop where DXY strength and EM capital outflows threaten the stability of the entire digital ecosystem.
Layer 1: Direct Impacts — The $87k Ceiling
The immediate market reality is one of technical and operational consolidation. Bitcoin’s inability to decisively breach the $87,334 level has acted as a magnet for profit-taking, but the reason for this stall is fundamentally different from previous cycles.
The primary catalyst is the community bank lawsuit against the OCC. This legal action targets the very foundation of how crypto-native firms act as custodians. When institutional on-ramps—the bridge between traditional finance and crypto—face legal uncertainty, the "buy" side of the market evaporates. Concurrently, operational cost-cutting measures at firms like Anchorage Digital signal that the industry is bracing for a "winter" of compliance, not growth. This is not just a price correction; it is a structural reassessment of the viability of crypto-native financial infrastructure.
Layer 2: Secondary Effects — The "Flight to Regulated"
The direct regulatory threat is triggering a classic "flight to quality," but with a crypto-specific twist: it is a flight to regulated structures.
Capital Deployment Pause: Institutional investors, particularly those bound by strict fiduciary mandates, are hitting the pause button. The risk of holding assets with a custodian currently under legal fire is too high. This is creating a liquidity fragmentation where capital is trapped in limbo, unable to enter the spot market through traditional banking rails.
Sector Rotation: We are observing a clear rotation out of crypto-native equities (COIN, MSTR) and into traditional financial services (XLF). Investors are betting that if the "crypto-native" banking model is compromised, the traditional banks that offer regulated exposure will be the ultimate winners.
Valuation Compression: Crypto-infrastructure firms are seeing their future cash flow projections slashed. The cost of compliance is ballooning, and the legal uncertainty makes long-term institutional partnerships—the lifeblood of these firms—increasingly difficult to secure.
Layer 3: Macro Propagation — The DXY-Crypto Contagion
The ripple effects of this crypto-specific friction are now interacting with broader macro trends, specifically the resurgence of the US Dollar (DXY).
As the DXY strengthens, global financial conditions tighten. This creates a "double-squeeze" for crypto. On one hand, the cost of dollar-denominated leverage increases, forcing liquidations in highly levered crypto-native equities. On the other hand, emerging market (EM) capital outflows are accelerating.
The contagion loop is distinct: when FIIs (Foreign Institutional Investors) in markets like India (NIFTY) face margin calls due to rising DXY and local currency (USDINR) weakness, they are forced to liquidate risk-on assets globally. Because crypto is often treated as the "most liquid" part of a speculative portfolio, it is the first asset class to be sold to cover these cross-border margin calls. We are effectively seeing a feedback loop where regulatory friction in the US creates a liquidity vacuum that is then exploited by macro-driven deleveraging.
Layer 4: Non-Obvious Cross-Connections — The Paradoxes
The most dangerous risks are those currently being ignored by the broader market.
The Regulatory-Custody Paradox: We are witnessing a decoupling of ETF prices (IBIT, FBTC) from spot BTC. Regulatory pressure on bank-custody is forcing capital out of ETFs and into direct, self-custodied BTC. This creates a "custodial discount" or "premium" where ETFs no longer track spot prices efficiently because the arbitrage mechanism—often dependent on the very banks now under legal fire—is breaking down.
AI-Infrastructure Divergence: There is a growing, hidden correlation between AI regulation and crypto infrastructure. As Jay Clayton (the rumored AI czar) pushes for "self-policing" in the AI sector, capital is beginning to view blockchain-based compute markets as a potential hedge. If AI hardware (NVDA, TSM) faces heavy-handed regulation, we may see a non-obvious rotation where capital flows into decentralized compute protocols (SOL/ETH ecosystems) as a way to "exit" the regulated AI hardware stack.
The 'Safe-Haven' Mirage: The market is currently treating GLD and XLF as the only safe havens. This is a synthetic flight to safety. By ignoring the underlying growth thesis of tokenization because of short-term regulatory noise, the market is mispricing the long-term utility of the blockchain—a classic "throw the baby out with the bathwater" scenario.
Unified OCS Chart Read
Chart capture is currently pending asynchronous enrichment. As of October 4, 2026, OCS liquidity and delta evidence for COIN, BTC, ETH, MSTR, and IBIT is unavailable.
Thesis Reconciliation:
While the chart evidence is unavailable, the current price action in COIN ($183.00) and BTC ($37.25) suggests a market in consolidation. The lack of clear directional momentum confirms the "liquidity trap" narrative. Without the OCS signal engine to confirm a breakout or breakdown, we must treat the $87k resistance (BTC) and $200 resistance (COIN) as the primary "hands-off" zones.
Risk Note: In the absence of chart confirmation, do not attempt to front-run the $87k level. The risk of a "liquidity vacuum" (where market makers pull liquidity, causing a flash-crash) is high given the current regulatory uncertainty.
Security-by-Security Analysis
COIN (Coinbase Global)
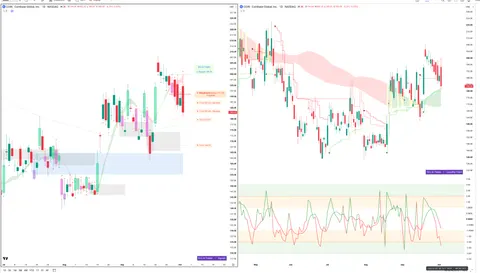
Fig. 1 COIN — Signals + Liquidity · open full sizeFig. 2 COIN — Delta + Technical · open full sizeCOIN — Unified OCS chart read
Executive Summary
The COIN structure is currently characterized by a high-conviction directional divergence between price action and order flow. While Chart 1 — Signals + Liquidity identifies a bearish 'Weakness Below' structure following a rejection of an extreme float-volume zone near 205.00, Chart 2 — Delta + Technical shows net buying pressure and price maintaining position above positive liquidity lines. The asset is currently caught between a bearish structural declaration and bullish delta participation.
OCS Confluence
Grade
Directional Bias
Participation State
low
neutral
unclear
Setup Read: COIN is exhibiting a divergence between bearish structural weakness and bullish delta-driven liquidity support.
Confirmations
Both charts identify the 180.00–181.00 zone as a critical structural pivot (Chart 1 Trigger: 181.05; Chart 2 Key Level: 180.81).
Price is currently operating above significant liquidity and structural floors (Chart 2: Positive liquidity bands/slow liquidity line; Chart 1: Above gray average float-volume zone).
Contradictions
Directional Conflict: Chart 1 declares a 'Weakness Below' short structure, whereas Chart 2 identifies a 'trend-continuation long' with bullish delta pressure.
Momentum Divergence: Chart 1 notes price is inside a 'pink momentum band' indicating negative cycle pressure, while Chart 2 reports a 'positive dominant delta cycle'.
Levels To Watch
199.75 (Stop/Invalidation - Chart 1)
181.05 (Short Trigger - Chart 1)
180.81 (Key Level/Confluence - Chart 2)
168.25 (Next Unbooked Target - Chart 1)
205.00 (Red Extreme Float-Volume Zone - Chart 1)
Invalidation
Structural failure occurs if price breaches the 199.75 invalidation level (Chart 1).
Risk Notes
High structural contradiction between signal engine and delta engine.
Setup exhaustion noted in Chart 1 due to previously booked upside targets.
Price is currently oscillating between the bearish momentum band and bullish liquidity floors.
COIN — Signals + Liquidity (click to expand)
Visible Context
Symbol
Timeframe
Layout Confidence
COIN
1D
high
Signal Engine
Direction
Declaration
Trigger
Trigger Status
Stop / Invalidation
SHORT
Weakness Below
181.05
Triggered
199.75
Target Ladder
T1
T2
T3
T4
T5
Booked
Next Unbooked
181.05
183.48
179.67
168.25
N/A
T1, T2, T3
T4 at 168.25
Structure Context
Float-Volume Zones
Momentum Band
Dominant Cycle
Price Location
Structural Context
Price is currently rejecting a red extreme float-volume zone near 205.00 and is positioned above a gray average float-volume reference zone.
weakness with price currently situated inside the pink momentum band
transition with pink ribbon indicating negative cycle pressure
Price is above the trigger (181.05) and current price (194.44), but below the stop (199.75) relative to the weakness declaration structure.
The setup is crowded as multiple upside targets have already been booked while price remains within the pink weakness band.
Setup Read
State
R:R to T1
R:R to Furthest
Invalidation
Evidence Quality
Notes
exhausted
N/A
N/A
Stop at 199.75
high
Price is currently operating within a pink weakness band and has rejected a red extreme float-volume zone, while several upside targets have already been booked.
COIN — Delta + Technical (click to expand)
OCS Layout Presence
Delta Configuration Badge
Delta Histogram / CVD
Liquidity Overlay / Cycle
Ocs Ai Trader | Delta Configuration
green and red volume columns at the bottom panel representing net accumulation/distribution
visible shaded liquidity bands (positive/green and negative/red) and stepped liquidity lines
Liquidity Engine
Active Band
Vs Slow Liquidity
Vs Fast Liquidity
Cycle State
Divergence
Hands-Off Risk
positive liquidity band with recent price pullback
above slow positive liquidity line
above fast positive liquidity line
fast and slow liquidity lines are showing upward momentum alignment
none
low
Delta Engine
CVD Pressure
Dominant Cycle Leader
Adaptive Filter
Delta Force
Exhaustion Boundary
net buying
positive
bullish floor
absent
none
Secondary TA
EMA
RSI
MACD
EMA 14 and EMA 50 visible
RSI 14 visible
MACD visible with signal line
Confluence
Setup Type
Directional Bias
Conviction
Confirmation
Contradiction
Key Level
trend-continuation long
bullish
medium
Price is currently trading within a positive liquidity band above the slow positive liquidity floor with a positive dominant delta cycle.
None visible.
180.81
* **Snapshot:** $183.00 (-3.32%)
* **Analysis:** COIN is the primary proxy for the "Regulatory-Custody Paradox." It is being hit by both the OCC lawsuit (legal risk) and the general BTC liquidity squeeze.
* **Levels to Watch:** $180 (Support - must hold to prevent a retest of the $164 Bollinger Band lower bound), $200 (Resistance - the "psychological ceiling").
* **Risk:** High. The firm is stuck between the need for institutional adoption and the reality of a hostile regulatory environment.
BTC (Bitcoin)
Fig. 3 BTC — Signals + Liquidity · open full sizeFig. 4 BTC — Delta + Technical · open full sizeBTC — Unified OCS chart read
Executive Summary
The current BTC environment presents a high-level structural conflict between bearish signal declarations and bullish delta participation. While Chart 1 — Signals + Liquidity identifies a potential short setup via a rejection of the 83745 pink weakness zone, Chart 2 — Delta + Technical shows net buying pressure and price maintaining position above the slow positive liquidity line. The consensus is one of directional uncertainty, as price trades in a strength regime despite the pending short trigger.
OCS Confluence
Grade
Directional Bias
Participation State
low
neutral
unclear
Setup Read: BTC exhibits a conflicting setup where bearish structural signals are currently being countered by positive delta and liquidity cycles.
Confirmations
Bullish cycle dominance: Chart 1 notes a bullish steep ribbon transition while Chart 2 reports a positive dominant delta cycle.
Support structure: Price remains above both the Chart 1 blue/gray float-volume zones and the Chart 2 slow positive liquidity line.
Contradictions
Directional Divergence: Chart 1 declares a 'Weakness Below' short signal (trigger 83745), whereas Chart 2 identifies a 'trend-continuation long' with bullish conviction.
Momentum Conflict: Chart 1 identifies price in a 'strength regime' above the trigger, contradicting the bearish signal declaration.
Levels To Watch
83745 (Short Trigger - Chart 1)
83131 (Structural Invalidation - Chart 1)
82745 (T1 Target - Chart 1)
80000 (Psychological/Liquidity Support - Chart 2)
79992 (Next Unbooked Target - Chart 1)
84825 (Current Price/Key Level - Chart 2)
Invalidation
Structural failure is defined by a breach of the 83131 stop (Chart 1) or a loss of the slow positive liquidity line support (Chart 2).
Risk Notes
Potential exhaustion as green CVD columns show decreasing magnitude (Chart 2).
Conflicting regime: Price is in a strength band despite a 'Weakness Below' declaration (Chart 1).
Low hands-off risk due to current price position relative to the short trigger (Chart 2).
BTC — Signals + Liquidity (click to expand)
Visible Context
Symbol
Timeframe
Layout Confidence
BTCUSDT - Bitcoin / U.S. Dollar 1D : Bitstamp
1D
high
Signal Engine
Direction
Declaration
Trigger
Trigger Status
Stop / Invalidation
SHORT
Weakness Below
83745
Not Triggered
83131
Target Ladder
T1
T2
T3
T4
T5
Booked
Next Unbooked
82745
80642
79992
N/A
N/A
None
79992
Structure Context
Float-Volume Zones
Momentum Band
Dominant Cycle
Price Location
Structural Context
Price is currently above the blue zone (approx 76k-77k) and the gray zone (approx 78k), and has recently rejected the pink weakness zone at 83745.
strength; price is trading within the green momentum band.
bullish with steep ribbon transition upward
Price is above the trigger (83745), above the stop (83131), and below T1 (82745).
The setup is conflicting because the signal declaration is Weakness Below, but price is currently trading in a strength regime above the trigger.
Setup Read
State
R:R to T1
R:R to Furthest
Invalidation
Evidence Quality
Notes
active
N/A
N/A
Stop at 83131
high
Price is currently within the green strength band and above the most recent blue float-volume zone, following a recent rejection of the pink weakness zone.
BTC — Delta + Technical (click to expand)
OCS Layout Presence
Delta Configuration Badge
Delta Histogram / CVD
Liquidity Overlay / Cycle
Ocs Ai Trader | Delta Configuration
Green and red CVD columns located in the bottom panel, showing net buying and selling accumulation.
Visible positive liquidity band (green shaded area) and slow positive liquidity line (pink/purple line) in the main price pane.
Liquidity Engine
Active Band
Vs Slow Liquidity
Vs Fast Liquidity
Cycle State
Divergence
Hands-Off Risk
positive
above slow positive line
N/A
slow positive line providing support below price; fast cycle not distinctly visible as a separate line in the main pane
none
low
Delta Engine
CVD Pressure
Dominant Cycle Leader
Adaptive Filter
Delta Force
Exhaustion Boundary
net buying
positive
bullish floor
absent
none
Secondary TA
EMA
RSI
MACD
EMA 21 close: 82,734, EMA 50 close: 84,257
RSI 14 close: 65.90 64.14
MACD close 12 26 9: -170 1,082 2,052
Confluence
Setup Type
Directional Bias
Conviction
Confirmation
Contradiction
Key Level
trend-continuation long
bullish
medium
Price is currently within a positive liquidity band and maintaining position above the slow positive liquidity line, supported by a positive dominant delta cycle.
The recent green CVD columns show decreasing magnitude compared to previous spikes, suggesting potential exhaustion.
* **Snapshot:** $37.25 (-0.51%)
* **Analysis:** The $87k level is the ultimate battlefield. It is not just a price point; it is the line between "institutional-grade asset" and "speculative risk-on asset."
* **Levels to Watch:** $87,334 (Resistance), $32.78 (Bollinger Lower Bound).
* **Risk:** Medium. The asset itself is resilient, but the *on-ramps* are under fire.
ETH (Ethereum)
Snapshot: $25.46 (-1.24%)
Analysis: ETH is suffering from liquidity fragmentation. As capital shifts toward self-custody, the L2 ecosystem (Blast, etc.) is seeing a chaotic migration.
Levels to Watch: $22.46 (Bollinger Lower Bound).
Risk: Medium. The shift toward non-custodial assets could be a long-term tailwind, but short-term volatility is elevated.
MSTR (MicroStrategy)
Snapshot: $160.01 (-0.31%)
Analysis: MSTR acts as the high-beta levered play on BTC. It is currently facing the brunt of the "DXY-driven deleveraging cycle."
Levels to Watch: $150 (Support), $176 (Bollinger Upper Bound).
Risk: High. Any further DXY strength will likely lead to accelerated selling here.
IBIT (BlackRock iShares Bitcoin Trust)
Snapshot: $47.73 (-0.48%)
Analysis: The ETF is the epicenter of the "Regulatory-Custody Paradox." Watch the premium/discount to spot closely.
Levels to Watch: $42.00 (Bollinger Lower Bound).
Risk: Medium. If the discount to spot widens, it confirms the institutional "pause."
Historical Parallels
The current regulatory-custody crisis bears a striking resemblance to the 2021 banking friction when regulators first began scrutinizing stablecoin reserves. The immediate outcome was a sharp contraction in liquidity, followed by a "flight to quality" where capital moved from smaller, non-compliant exchanges to larger, regulated entities. However, the current environment is more complex due to the existence of ETFs. We are in uncharted territory where the "safe harbor" (ETFs) is itself the target of the regulatory scrutiny.
Resolution of OCC litigation, ETF liquidity flows.
Scenarios:
Bull Case: A swift, positive resolution to the OCC litigation restores institutional confidence, allowing BTC to break the $87k resistance and test $90k+.
Base Case: Continued regulatory stalemate keeps the market in a liquidity trap between $80k and $87k, with high volatility and frequent stop-loss hunting.
Bear Case: The OCC lawsuit forces a major custodial exit, causing a liquidity vacuum that triggers a cascading deleveraging event, pushing BTC toward the $75k support zone.
What to Watch
OCC Litigation Updates: Any news regarding the community bank lawsuit is the single most important variable.
DXY Movements: If the DXY continues to surge, expect the "DXY-driven deleveraging loop" to intensify, putting downward pressure on all crypto assets.
ETF Flows: Monitor the premium/discount of IBIT and FBTC. A widening discount is a leading indicator of institutional capital flight.
AI Regulatory 'Czars': Any specific mandates from a new AI czar regarding "self-policing" will be the next major catalyst for the AI-crypto divergence trade.
Education and market research only, not financial advice. Charts are OCS AI Trader readings at the time of writing and change with new bars.