The ECB's Diagnostic Trap: Gold, Silver, and the DXY Liquidity Squeeze
Executive summary
The global macro landscape is currently defined by a widening divergence between US economic resilience and Eurozone policy ambiguity. Following ECB Chief Economist Philip Lane’s October 5 keynote, the market is grappling with the central bank’s admitted "diagnostic challenges" in navigating concurrent energy supply shocks and economic stagnation. This policy uncertainty has catalyzed a structural capital flight from the Eurozone into USD-denominated safe havens, strengthening the DXY and creating a paradoxical environment for precious metals. While gold functions as a hedge against European instability, it faces mounting headwinds from US real-yield strength and emerging market liquidity constraints. Silver, meanwhile, remains trapped in a structural conflict between its role as an inflation hedge and its vulnerability to the manufacturing demand destruction signaled by the ECB’s own supply-shock warnings.
Layer 1: The Trigger — ECB Diagnostic Uncertainty
The immediate catalyst for current market volatility is the explicit admission by the European Central Bank regarding the difficulty of setting monetary policy amidst multi-faceted shocks. Philip Lane’s speech highlights that the ECB is no longer simply managing interest rates; it is attempting to diagnose the structural impact of energy supply shocks on a fragile Eurozone economy.
For the precious metals complex, this has immediate implications. The uncertainty surrounding ECB policy is driving a "flight to quality" into USD-denominated assets. Gold (XAU, GC=F) and silver (XAG, SI=F) are seeing demand as safe-haven vehicles, yet this is being counter-balanced by the reality of the ECB’s focus on energy supply shocks, which inherently raises the cost of production and fuels inflationary expectations. The market is effectively pricing in a "stagflationary trap" for the Eurozone, where the ECB is forced to choose between supporting growth or containing energy-driven inflation.
Layer 2: Secondary Effects — The Yield-Advantage Trade
As the ECB signals a potential policy paralysis, the divergence with US data becomes stark. Recent hawkish ISM services data from the US creates a "yield-advantage" trade that is actively suppressing non-yielding assets.
Investors are increasingly rotating capital out of EUR-denominated assets and into USD-denominated safe havens. This is not merely a currency move; it is a fundamental shift in the opportunity cost of capital. As US front-end yields (US 2Y) rise in response to domestic hawkishness, the discount rate for non-yielding assets like gold increases. This creates a friction point: while investors desire gold for its safe-haven characteristics, the rising opportunity cost of holding it—compared to the yield available in USD-denominated cash equivalents—is capping the upside.
Simultaneously, the energy sector (XLE, WTI, BRENT) is experiencing heightened volatility. The ECB’s focus on energy supply shocks acts as a signal for potential industrial contraction. This is particularly negative for silver, which relies on industrial demand. The "hedging premium" that usually supports silver during energy shocks is currently being eroded by the prospect of manufacturing demand destruction in the Eurozone.
Layer 3: Macro Propagation — Emerging Market Stress
The propagation of these effects is most visible in emerging markets (EM). A stronger DXY, driven by the flight of capital from the Eurozone, is forcing a liquidity tightening event in EM economies.
In price-sensitive regions like India, the rising cost of USD-denominated gold (USDINR impact) is dampening physical demand. We are observing a feedback loop:
- ECB ambiguity leads to EUR selling and USD buying.
- DXY strengthens.
- Local currency costs for gold in EM rise.
- Physical demand in these core consumption markets softens.
This creates a structural ceiling for gold prices. Even as geopolitical tensions provide a floor, the liquidity constraints imposed by the DXY strength prevent a breakout. We are seeing a "tug-of-war" between safe-haven demand (driven by Eurozone instability) and liquidity-driven deleveraging (driven by DXY and US yield strength).
Layer 4: Non-Obvious Connections — The Structural Paradoxes
The most critical takeaway for institutional participants is the emergence of two structural paradoxes that defy traditional gold-market logic.
The Silver Paradox: Industrial Demand vs. Stagflationary Hedge
Silver is currently caught in a structural decoupling. Typically, silver acts as both an industrial metal and an inflation hedge. However, the energy-driven inflation (which supports the hedge narrative) is the exact force causing Eurozone manufacturing contraction (which destroys the industrial narrative). Investors long on silver as an inflation hedge are failing to account for the fact that the same energy shock is systematically eroding the industrial base that supports silver’s price floor.
The DXY Liquidity Trap


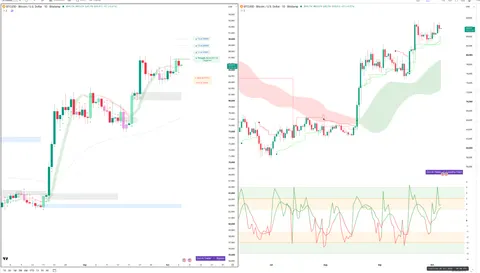
DXY — Unified OCS chart read
Executive Summary
The DXY presents a bullish trend-continuation setup characterized by high-conviction delta accumulation. While Chart 1 — Signals + Liquidity identifies a potential regime shift due to price rejecting a pink float-volume resistance zone near 101.50, Chart 2 — Delta + Technical confirms robust participation through net buying CVD and alignment above both fast and slow positive liquidity lines.
OCS Confluence
| Grade | Directional Bias | Participation State |
|---|---|---|
| high | bullish | active |
Setup Read: DXY is exhibiting bullish liquidity alignment and net buying pressure despite immediate resistance at the 101.50 float-volume zone.
Confirmations
- Bullish momentum regime identified in Chart 1 (green strength band) aligns with net buying accumulation in Chart 2 (green CVD columns).
- Price is currently testing a key structural resistance zone (Chart 1) while maintaining positive liquidity alignment (Chart 2).
Contradictions
- Chart 1 notes a conflicting setup where price is rejecting a pink float-volume resistance zone, whereas Chart 2 shows no visible contradictions and high conviction for trend continuation.
Levels To Watch
- 102.142 (Current Price - Chart 2)
- 101.614 (Slow Positive Liquidity Line - Chart 2)
- 101.50 (Pink Extreme Float-Volume Resistance Zone - Chart 1)
- 100.24 (Catastrophic Stop - Chart 1)
Invalidation
Structural failure occurs upon a catastrophic breach of the 100.24 level (as referenced in Chart 1).
Risk Notes
- Potential for regime shift if pink resistance rejection holds (Chart 1).
- Low hands-off risk due to bullish liquidity alignment (Chart 2).
DXY — Signals + Liquidity (click to expand)
Visible Context
| Symbol | Timeframe | Layout Confidence |
|---|---|---|
| DXY - U.S. Dollar Index | 1D | medium |
Signal Engine
| Direction | Declaration | Trigger | Trigger Status | Stop / Invalidation |
|---|---|---|---|---|
| NEUTRAL | no visible declaration | N/A | N/A | N/A |
Target Ladder
| T1 | T2 | T3 | T4 | T5 | Booked | Next Unbooked |
|---|---|---|---|---|---|---|
| N/A | N/A | N/A | N/A | N/A | N/A | N/A |
Structure Context
| Float-Volume Zones | Momentum Band | Dominant Cycle | Price Location | Structural Context |
|---|---|---|---|---|
| Price is currently testing/rejecting a pink extreme float-volume resistance zone near 101.50. | strength (price is currently located within the green strength band) | transition (ribbon flattening/shifting from green to pink transition) | Price is currently within the green momentum band, testing the pink weakness zone, with no visible scaffold triggers/stops/targets. | The setup is conflicting as price sits in a green momentum regime but is actively rejecting a pink float-volume resistance zone. |
Setup Read
| State | R:R to T1 | R:R to Furthest | Invalidation | Evidence Quality | Notes |
|---|---|---|---|---|---|
| unclear | N/A | N/A | catastrophic stop at 100.24 (as per signal logic structure if applied, though specific text label is not visible in the provided view) | medium | Price is currently within a green momentum strength band and reacting off a pink weakness/resistance zone, showing potential for a regime shift. |
DXY — Delta + Technical (click to expand)
OCS Layout Presence
| Delta Configuration Badge | Delta Histogram / CVD | Liquidity Overlay / Cycle |
|---|---|---|
| Ocs Ai Trader | Delta Configuration badge is visible on the mid-panel left side. | Green CVD columns are visible in the bottom panel indicating net buying accumulation. | N/A |
Liquidity Engine
| Active Band | Vs Slow Liquidity | Vs Fast Liquidity | Cycle State | Divergence | Hands-Off Risk |
|---|---|---|---|---|---|
| positive | above slow positive line | above fast positive line | bullish alignment | none | low |
Delta Engine
| CVD Pressure | Dominant Cycle Leader | Adaptive Filter | Delta Force | Exhaustion Boundary |
|---|---|---|---|---|
| net buying | positive | N/A | absent | none |
Secondary TA
| EMA | RSI | MACD |
|---|---|---|
| EMA 5 and EMA 21 visible | RSI 14 close visible | MACD 12 26 9 visible |
Confluence
| Setup Type | Directional Bias | Conviction | Confirmation | Contradiction | Key Level |
|---|---|---|---|---|---|
| trend-continuation long | bullish | high | Price is currently trading within a positive liquidity band and above both fast and slow positive liquidity lines. | None visible. | 102.142 (current price) / 101.614 (slow positive liquidity line) |
Unified OCS Chart Read
Note: Formal OCS signal engine capture for XAU, XAG, and DXY is currently in the asynchronous enrichment queue. The following analysis is based on available price history and technical indicators.
Setup Read: The technical landscape for the precious metals complex is currently "hands-off" for aggressive trend-following, as the fundamental narrative (safe-haven demand) is in direct conflict with the technical momentum (weakness).
- GC=F (Gold Futures): With an RSI of 34, gold is approaching oversold territory but lacks the bullish divergence required for a structural reversal. The MACD at -64.12 confirms a bearish trend. The price ($4161.60) is hovering near the lower Bollinger Band ($4116.32), suggesting that while downside is limited, a catalyst is required to break the current consolidation.
- SI=F (Silver Futures): Silver’s RSI of 42.08 indicates a lack of conviction. The MACD is negative (-1.1), and the price ($61.23) is well below the 20d SMA ($63.69). This confirms the "Silver Paradox" mentioned in Layer 4—the asset is failing to catch a bid despite the broader energy-driven inflation narrative.
Conclusion: Charts currently contradict the "safe-haven" thesis. Until technical momentum shifts to favor the upside, the market is likely to remain in a range-bound, liquidity-constrained state.
Security-by-Security Analysis
Gold (XAU, GC=F, GLD)


GC=F — Unified OCS chart read
Executive Summary
The consensus direction is bearish, characterized by a high-conviction trend-continuation setup. The Signal Engine (Chart 1) declares a 'Weakness Below' state with price rejecting extreme float-volume zones, while the Delta Engine (Chart 2) confirms aggressive net selling via negative CVD columns and price trading below both fast and slow negative liquidity lines.
OCS Confluence
| Grade | Directional Bias | Participation State |
|---|---|---|
| high | bearish | active |
Setup Read: The setup shows a high-conviction bearish continuation as momentum weakness and negative delta force align with structural targets.
Confirmations
- Bearish alignment between Signal Engine (Chart 1) and Delta Engine (Chart 2)
- Price location within weakness bands (Chart 1) confirmed by trading below negative liquidity lines (Chart 2)
- High conviction driven by net selling CVD pressure (Chart 2) and a clean Weakness Below declaration (Chart 1)
Contradictions
- (none)
Levels To Watch
- 4414.1 (Trigger/Stop - Chart 1)
- 4161.3 (Key Resistance Area - Chart 2)
- 4037.6 (Next Unbooked Target T4 - Chart 1)
- 4480-4500 (Extreme Float-Volume Zone - Chart 1)
- Lower edge of bearish liquidity zone (Chart 2)
Invalidation
Structural failure is defined by a breach above the trigger level of 4414.1 (Chart 1).
Risk Notes
- Low hands-off risk due to alignment of fast and slow negative liquidity lines (Chart 2)
- Potential for exhaustion as price approaches unbooked target T4 (Chart 1)
GC=F — Signals + Liquidity (click to expand)
Visible Context
| Symbol | Timeframe | Layout Confidence |
|---|---|---|
| GC=F | 1D | high |
Signal Engine
| Direction | Declaration | Trigger | Trigger Status | Stop / Invalidation |
|---|---|---|---|---|
| SHORT | Weakness Below | 4414.1 | Triggered | 4414.1 |
Target Ladder
| T1 | T2 | T3 | T4 | T5 | Booked | Next Unbooked |
|---|---|---|---|---|---|---|
| 4234.5 (Booked) | 4219.6 (Booked) | 4174.1 (Booked) | 4037.6 | 3954.3 | T1, T2, T3 | T4 at 4037.6 |
Structure Context
| Float-Volume Zones | Momentum Band | Dominant Cycle | Price Location | Structural Context |
|---|---|---|---|---|
| Price is rejecting the pink extreme float-volume zone near 4480-4500 | weakness; price is trading within the pink momentum weakness band | bearish; pink ribbon is active and descending | Price is below the trigger (4414.1) and between booked T3 and pending T4 | The setup is clean with multiple historical completion points (booked targets) and alignment between momentum bands and dominant cycle pressure. |
Setup Read
| State | R:R to T1 | R:R to Furthest | Invalidation | Evidence Quality | Notes |
|---|---|---|---|---|---|
| active | N/A | N/A | Stop at 4414.1 | high | Price is currently rejecting a pink extreme float-volume zone and sits within a pink momentum weakness band, aligned with a Weakness Below declaration that has multiple booked targets. |
GC=F — Delta + Technical (click to expand)
OCS Layout Presence
| Delta Configuration Badge | Delta Histogram / CVD | Liquidity Overlay / Cycle |
|---|---|---|
| Ocs Ai Trader | Delta Configuration | Green/red CVD columns at the bottom with green delta-force arrows and red delta-force arrows. | Visible shaded liquidity bands (pink/red for negative, green for positive) and stepped liquidity lines on the price chart. |
Liquidity Engine
| Active Band | Vs Slow Liquidity | Vs Fast Liquidity | Cycle State | Divergence | Hands-Off Risk |
|---|---|---|---|---|---|
| negative, with price currently testing the lower edge of the bearish zone | below slow negative line | below fast negative line | fast and slow negative lines are aligned downward | none | low |
Delta Engine
| CVD Pressure | Dominant Cycle Leader | Adaptive Filter | Delta Force | Exhaustion Boundary |
|---|---|---|---|---|
| net selling | negative | bearish ceiling | recent red arrows | none |
Secondary TA
| EMA | RSI | MACD |
|---|---|---|
| EMA 9 and EMA 21 are visible | RSI 14 is visible | MACD line and signal line are visible |
Confluence
| Setup Type | Directional Bias | Conviction | Confirmation | Contradiction | Key Level |
|---|---|---|---|---|---|
| trend-continuation short | bearish | high | Negative liquidity band is active and price is trading below both fast and slow negative liquidity lines, supported by red CVD columns and negative delta-force arrows. | None visible. | 4,161.3 (current price/resistance area) |
Silver (XAG, SI=F, SLV)
- Current State: Trading at $61.23, struggling to find a floor.
- Analysis: Silver is the most vulnerable asset in this environment. The industrial demand destruction thesis is weighing heavily on the price, and the lack of a clear inflation-hedge narrative is preventing it from tracking with gold.
- Watch: Monitor the 20d SMA ($63.69). A failure to reclaim this level reinforces the bearish industrial demand thesis.
DXY (US Dollar Index)
- Current State: The primary beneficiary of the "flight to quality" trade.
- Analysis: As long as the ECB remains in a "diagnostic" phase without a clear policy path, the DXY will likely remain supported. This is the "liquidity anchor" for the entire precious metals complex.
Historical Parallels
The current environment bears a striking resemblance to the 2011-2012 period, where the Eurozone sovereign debt crisis created a similar divergence. During that period, gold initially rallied on safe-haven demand, only to be crushed by a surging USD and rising US real yields as the market realized the ECB was essentially paralyzed. The key difference today is the energy-supply shock component, which adds a layer of stagflationary risk that was less pronounced in 2011.
Outlook & Risk Matrix
Short-Term (1-5 Days)
- Base Case: Continued range-bound volatility. The market will likely wait for further clarity on ECB policy or US labor data.
- Risk: A sudden spike in energy prices (BRENT) could force a re-evaluation of the "stagflationary trap," potentially triggering a short-term bid for gold despite DXY strength.
Medium-Term (1-4 Weeks)
- Base Case: The "DXY Liquidity Trap" continues to suppress gold and silver prices. The lack of clear policy direction from the ECB will likely keep capital flowing into USD-denominated assets.
- Risk: If US ISM services data shows a sharper-than-expected cooling, the "yield-advantage" trade could unwind, providing the necessary relief for precious metals to decouple from DXY strength.
What to Watch
- ECB Communication: Any shift from "diagnostic" to "actionable" policy will be the primary pivot point for EURUSD and, by extension, the DXY.
- US Front-End Yields (US 2Y): This remains the hurdle rate for gold. Watch for any signs of the yield curve flattening, which would suggest a loss of confidence in the Fed's hawkish stance.
- Physical Gold Demand (India/China): Monitor premiums in these markets. If physical premiums begin to rise despite the strong USD, it would indicate that the "liquidity trap" is being overcome by fundamental demand.
- Energy Sector (XLE) vs. Silver (SI=F): The widening gap between energy sector performance and silver prices is the leading indicator for the "Silver Paradox." If this gap continues to widen, expect further downside for silver.
Education and market research only, not financial advice. Charts are OCS AI Trader readings at the time of writing and change with new bars.