ECB Collateral Overhaul Triggers EUR Liquidity Squeeze and Capital Rotation
Executive summary
The global macro landscape is currently dominated by a structural liquidity shift triggered by the European Central Bank’s (ECB) impending monetary policy implementation overhaul, effective November 30, 2026. This regulatory friction—specifically stricter collateral haircuts and rating criteria—is inducing a pre-emptive "dash for cash" within the Eurozone. We are witnessing a cascading impact: from the immediate repricing of European bank liquidity, through a violent unwinding of EUR-funded carry trades, to a structural rotation of capital toward US-denominated assets. Despite a softening US labor market, the USD remains structurally supported by this global liquidity drain, creating a "real yield trap" that suppresses precious metals and forces a divergence in equity sector performance.
Layer 1: Direct Impacts — The Collateral-Carry Trap
The immediate market reaction is centered on the repricing of EUR-denominated assets. The ECB’s updated monetary policy guidelines, while seemingly administrative, have acted as a catalyst for institutional deleveraging.
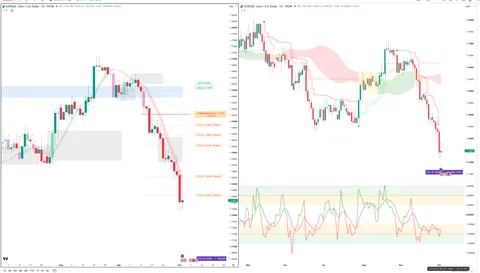
- EURUSD Depreciation: The pair is under persistent downward pressure, testing the 1.08 support level. The mechanism is a widening interest rate differential: while the Federal Reserve maintains a restrictive stance, the ECB’s collateral rule changes are forcing European banks to re-evaluate their balance sheets, leading to a reduction in EUR-denominated holdings.
- European Financial Sector Repricing (XLF): European banking institutions are the primary vector of this stress. The shift in collateral valuation rules directly impacts net interest margins (NIMs) and capital efficiency. Institutional investors are rotating out of European financials, viewing the regulatory environment as a drag on profitability.
- Safe-Haven USD Flows: Capital is fleeing the Eurozone for USD liquidity. This is not a vote of confidence in US growth—which showed signs of cooling in the October 2 payroll data—but a flight to the safety of USD-denominated High-Quality Liquid Assets (HQLA).
Layer 2: Secondary Effects — Deleveraging and Sector Rotation
The direct impacts are bleeding into broader market dynamics, specifically through the unwinding of risk-on positions.
- Carry Trade Unwinds: The EURJPY cross is experiencing heightened volatility. The carry trade, which relied on the stability of the Euro and the yield differential, is collapsing. As institutions unwind EUR-funded positions, they are forced to repatriate capital, triggering sudden spikes in volatility that are spilling over into the broader FX market.
- Industrial Margin Compression: The combination of a weakening Euro and persistent energy price volatility (BRENT/WTI) is creating an "imported inflation" loop for Eurozone industrial firms. This margin compression is driving a secondary rotation: capital is leaving European industrial conglomerates and flowing into US-based AI and semiconductor leaders (SMH, NVDA), which are perceived as having greater pricing power and resilience.
- Gold’s Correlation Break: GLD and XAU are struggling. Normally, geopolitical tension (Middle East/Lajes Base) would support gold. However, the current "real yield trap"—where rising US front-end yields (driven by the scramble for USD liquidity) increase the opportunity cost of holding non-yielding assets—is overriding the geopolitical risk premium.
Layer 3: Macro Propagation — The Liquidity Feedback Loop
The propagation of these effects is creating a bifurcated global market.
- The Yield Reversal: The October 2 US jobs report was soft (payroll growth missed, wage growth slowed), which initially triggered a drop in Treasury yields and a weaker dollar. However, this move was short-lived. The market quickly reversed, with yields ending higher. This disconnect confirms that liquidity concerns—driven by the ECB collateral rules—are currently dominating growth concerns. The market is prioritizing cash (USD) over the economic cycle.
- Emerging Market FII Outflows: The global liquidity drain is disproportionately affecting emerging markets. As capital rotates from Eurozone assets into USD-yielding instruments, the resulting liquidity vacuum is forcing FIIs to exit higher-beta EM positions, leading to currency depreciation in countries like India (USDINR) and pressure on Nifty derivatives.
- Divergent Banking Performance: A widening chasm is forming between European and US banking sectors. While ECB rules squeeze European NIMs, US banks are benefiting from the "flight to quality," as capital seeks the relative stability of the US financial system.
Layer 4: Non-Obvious Cross-Connections
The most critical, non-obvious connection is the "Volatility Paradox" within the carry trade.
- The Volatility Paradox: The liquidation of EUR-funded carry trades creates a feedback loop where EURJPY volatility spikes. This, in turn, forces a rapid unwinding of long-JPY positions against the USD. Effectively, the market is "importing" volatility into the USDJPY pair. Even though the Fed is hawkish, the USDJPY is becoming a proxy for global risk appetite; when the carry trade unwinds, the JPY strengthens against the USD, creating a confusing price action where USD strength (DXY) and JPY strength (FXY) can coexist during periods of acute stress.
- Semiconductor Proxy Trade: We are seeing US tech (NVDA, TSM) act as a hidden proxy for European industrial capital flight. As European industrial margins compress due to energy costs and regulatory headwinds, institutional capital is not moving to cash alone; it is rotating into US tech, which offers a "compliance moat" and higher margin resilience, essentially decoupling US AI leadership from the broader stagnation in European industrial output.
Unified OCS Chart Read
Note: OCS chart evidence for EURUSD, DXY, EURJPY, and UUP is currently deferred to the asynchronous repair queue. Consequently, specific OCS signal candles and trigger levels are unavailable at this time. The analysis provided herein is derived from fundamental macro data and price action trends.
- EURUSD: Price action is testing the 1.08 level. Without OCS confirmation, we note that a sustained break below this round number would signal an acceleration of the current downtrend.
- USDJPY: Volatility is elevated. Watch the 150 level as a psychological pivot.
- UUP: The ETF is trading near its recent range highs ($28.90). A break above $29.00 would confirm the structural strength thesis.
Security-by-Security Analysis
EURUSD
- Analysis: The pair is the primary battleground for the ECB collateral shift. The 1.08 level is the critical line in the sand. A breach likely triggers a move toward the 1.07 handle.
- Risk: The primary risk is an abrupt change in ECB rhetoric regarding the November 30 implementation, which could trigger a short squeeze.
DXY (US Dollar Index)
- Analysis: DXY is acting as the ultimate safe haven. Its strength is not merely a function of US economic data, but a function of global liquidity withdrawal.
- Key Level: Maintain focus on the 104-105 resistance zone.
EURJPY
- Analysis: This is the "volatility barometer." The cross is highly sensitive to the unwinding of the carry trade. Expect erratic, gap-prone price action.
- Risk: High. This pair is currently unsuitable for directional trend-following strategies due to the feedback loop of liquidity-driven volatility.
XLF (Financials)
- Analysis: XLF is under pressure, reflecting the global banking sector's sensitivity to collateral rule changes.
- Outlook: Bearish until the November 30 implementation deadline passes and the market prices in the new regulatory reality.
GLD (Gold)
- Analysis: Caught in a "real yield trap." Despite geopolitical tensions, the USD strength is the dominant force.
- Outlook: Neutral to Bearish. Gold requires a sustained decline in US front-end yields to regain its safe-haven luster.
Historical Parallels
The current ECB collateral overhaul bears a structural resemblance to the liquidity-tightening phases of the 2012 Eurozone crisis, specifically the period leading up to the implementation of the OMT (Outright Monetary Transactions) framework. In late 2012, similar concerns regarding collateral eligibility and bank liquidity led to a sharp, albeit temporary, surge in USD demand and a corresponding unwind of EUR-denominated carry trades. The primary difference today is the presence of elevated global energy volatility, which exacerbates the stagflationary risk that was less pronounced in 2012.
Outlook & Risk Matrix
- Short-Term (1-5 Days): Expect continued volatility in EUR crosses. The market will likely remain focused on the "dash for cash," supporting the USD and pressuring risk-sensitive assets.
- Medium-Term (1-4 Weeks): The focus will shift toward the October 29 ECB policy meeting. If the ECB maintains a hawkish tone despite the collateral-induced liquidity squeeze, expect a further widening of the EUR-USD yield differential.
- Scenarios:
- Base Case: Continued EURUSD depreciation, testing 1.08 support; USD strength persists.
- Bull Case (for EUR): ECB signals a delay or softening of the November 30 collateral rules, triggering a massive short-covering rally.
- Bear Case (for Risk): Liquidity contagion spreads from European banks to US regional banks, causing a spike in credit spreads and a broader equity market correction.
What to Watch
- October 29 ECB Meeting: The most critical event for the EUR. Watch for any mention of the November 30 collateral rule implementation.
- November 30 Deadline: The date the new ECB collateral rules go into effect. Expect market volatility to peak in the days leading up to this.
- US Treasury Yields: If yields continue to rise despite soft economic data, it confirms the "liquidity trap" thesis and supports the USD.
- EURJPY Volatility: A spike here is the "canary in the coal mine" for broader carry trade contagion.
Education and market research only, not financial advice. Charts are OCS AI Trader readings at the time of writing and change with new bars.