The Geopolitical Paradox: Gold’s Capitulation and the Stagflationary Trap
Executive summary
Global markets are currently witnessing a profound decoupling: while geopolitical risk in the Middle East—specifically involving Egypt, Yemen, and new U.S. regulatory scrutiny on Iranian oil—is intensifying, the traditional safe-haven bid for gold has evaporated. Gold (GC=F) is currently capitulating, trading down 2.76% at $4037.40, as market participants prioritize hawkish Federal Reserve interest rate expectations over geopolitical hedging. This phenomenon reveals a sophisticated "Stagflationary Trap": the market is pricing in a scenario where energy supply shocks force the Fed to maintain higher-for-longer rates, thereby crushing non-yielding bullion despite the obvious increase in global insecurity.
The Cascading Impact Chain: A Layered Analysis
Layer 1: Direct Impacts (The Event)
The primary driver today is a collision between geopolitical escalation and macroeconomic reality. The U.S. regulatory probe into Iranian oil trading, combined with Egypt’s military signaling regarding Saudi territorial defense, has introduced a tangible supply-side risk premium into the energy complex. Simultaneously, the market is aggressively repricing the "no-landing" scenario, with labor market strength (as noted in recent jobless claim data) forcing a hawkish tilt in Fed policy expectations. The direct result is a sharp, volume-backed sell-off in gold (GC=F) and silver (SI=F), which are being liquidated to fund margin calls or rotate into higher-yielding duration assets.
Layer 2: Secondary Effects (The Rotation)
This capitulation in precious metals is catalyzing a broader institutional rotation. As gold fails to provide the expected safe-haven buffer, capital is fleeing high-growth tech proxies (NVDA, SMH) and moving toward defensive sectors (XLP, XLU) and, crucially, long-duration Treasuries (TLT). The supply chain risk premium is now being aggressively embedded in energy prices (BRENT, WTI), which, while beneficial for energy stocks (XLE), is simultaneously compressing margins for consumer discretionary (XLY) and staples (XLP) as logistics costs surge.
Layer 3: Macro Propagation (The Ripple)
The macro ripple is twofold. First, the energy supply chain risk premium is expanding, threatening to keep headline inflation stickier than the Fed anticipates. Second, we are observing a significant emerging market (EM) stress signal. FII capital is fleeing markets like India (NIFTY) as the dual pressure of higher energy imports (weakening the INR) and a strengthening DXY creates a liquidity squeeze. The "safe haven" trade is no longer gold; it is the U.S. Dollar.
Layer 4: Non-Obvious Cross-Connections (The Trap)
The most critical insight is the "Stagflationary Trap" feedback loop. Historically, geopolitical instability drives gold higher. Today, that instability (in the Red Sea/Suez) creates an inflationary energy shock. That inflation forces the FOMC to maintain a restrictive policy stance, which drives real rates higher. Higher real rates increase the opportunity cost of holding gold, leading to liquidation. Thus, the geopolitical instability that should boost gold is the very thing preventing it from functioning as a hedge. This is a structural decoupling that will likely persist until the energy risk premium is either resolved or fully absorbed into the cost basis of the global economy.
Unified OCS Chart Read
Status: Setup pending.
Reconciliation: The news thesis—that gold is decoupling from geopolitical risk due to real-rate pressure—is supported by the price action in GC=F ($4037.40) and GLD ($369.00). The RSI(14) for GC=F at 32.64 suggests the asset is approaching oversold territory but has not yet signaled a technical reversal. We are watching for a failure to hold the $4000 psychological level, which would confirm the bearish momentum. The divergence between the geopolitical narrative (bullish for gold) and the price action (bearish) suggests that the "Fed/Real Rate" narrative remains the dominant liquidity driver.
Security-by-Security Analysis
Gold (GC=F / GLD)
Fig. 1 GLD — Signals + Liquidity · open full sizeFig. 2 GLD — Delta + Technical · open full sizeGLD — Unified OCS chart read
Executive Summary
The consensus direction for GLD is bearish, driven by a high-confidence structural weakness declaration in Chart 1 — Signals + Liquidity. While the structural framework shows successful completion of T1 and T2 targets, the Chart 2 — Delta + Technical read indicates a period of diminished participation characterized by tangled liquidity cycles and mixed CVD pressure, suggesting a transition phase.
OCS Confluence
Grade
Directional Bias
Participation State
medium
bearish
active
Setup Read: GLD maintains a bearish structural bias with completed initial targets, though delta and liquidity metrics suggest a transition into a lower-conviction participation state.
Confirmations
Both charts align on a bearish regime (Pink momentum band in Chart 1; negative liquidity bands in Chart 2).
Price is currently trading below the primary trigger level of 377.23 (Chart 1).
Structural weakness is supported by RSI being in a low regime of 35.66 (Chart 2).
Contradictions
Chart 1 shows high evidence quality for the bearish trend, whereas Chart 2 indicates low conviction due to tangled cycles and mixed delta force.
Levels To Watch
377.23 (Trigger - Chart 1)
381.53 (Catastrophic Stop - Chart 1)
364.93 (Next Unbooked Target - Chart 1)
380.00 (Key Level - Chart 2)
377.88 (9 EMA - Chart 2)
364.14 (21 EMA - Chart 2)
Invalidation
Structural failure occurs upon a price breach above the catastrophic stop at 381.53 (Chart 1).
Risk Notes
Uncertainty in liquidity bands and tangled cycles may lead to chop (Chart 2).
Mixed CVD and delta-force markers indicate a lack of clear directional engagement (Chart 2).
Price is currently rejecting the gray average float-volume zone, which may influence near-term velocity (Chart 1).
GLD — Signals + Liquidity (click to expand)
Visible Context
Symbol
Timeframe
Layout Confidence
GLD - SPDR Gold Shares
1D
high
Signal Engine
Direction
Declaration
Trigger
Trigger Status
Stop / Invalidation
SHORT
Weakness Below
377.23
Triggered
381.53
Target Ladder
T1
T2
T3
T4
T5
Booked
Next Unbooked
373.14 (Booked)
371.59 (Booked)
364.93
361.17
N/A
T1, T2
364.93
Structure Context
Float-Volume Zones
Momentum Band
Dominant Cycle
Price Location
Structural Context
Price is currently rejecting the gray average float-volume zone near 370.00 and trending toward the pink extreme float-volume zone below.
weakness; price is operating within the pink momentum weakness band.
bearish; the pink dominant-cycle ribbon is sloping downward and providing overhead pressure.
Price is currently below the trigger (377.23) and the stop (381.53), trending toward unbooked targets T3 and T4.
The setup shows high confluence as price is aligned with a weakness declaration, the pink momentum band, and the pink dominant-cycle ribbon.
Setup Read
State
R:R to T1
R:R to Furthest
Invalidation
Evidence Quality
Notes
active
N/A
N/A
Price breach above the catastrophic stop at 381.53.
high
The bearish regime is supported by multi-layer confluence including the momentum band, dominant cycle ribbon, and completed initial targets.
GLD — Delta + Technical (click to expand)
OCS Layout Presence
Delta Configuration Badge
Delta Histogram / CVD
Liquidity Overlay / Cycle
Ocs Ai Trader | Delta Configuration badge is visible in the middle-left section of the chart.
Green and red CVD columns are visible at the bottom panel, along with green and red delta-force arrows.
Visible liquidity bands (green and red shading) and liquidity cycle lines are present behind the price action.
Liquidity Engine
Active Band
Vs Slow Liquidity
Vs Fast Liquidity
Cycle State
Divergence
Hands-Off Risk
negative liquidity band, with latest price recently exiting the band and moving through a transition zone.
below slow negative liquidity line
below fast negative liquidity line
tangled/crossing
none
high due to uncertain liquidity band/transition and tangled cycles
Delta Engine
CVD Pressure
Dominant Cycle Leader
Adaptive Filter
Delta Force
Exhaustion Boundary
mixed
tangled
mixed
mixed recent green and red arrows
none
Secondary TA
EMA
RSI
MACD
9 EMA (377.88) and 21 EMA (364.14) are visible
RSI 14 is 35.66
MACD 12 26 9 is -0.2127
Confluence
Setup Type
Directional Bias
Conviction
Confirmation
Contradiction
Key Level
hands-off
bearish
low
N/A
Uncertain liquidity band, tangled dominant cycles, and mixed CVD/force markers indicate a lack of clear directional engagement.
380.00
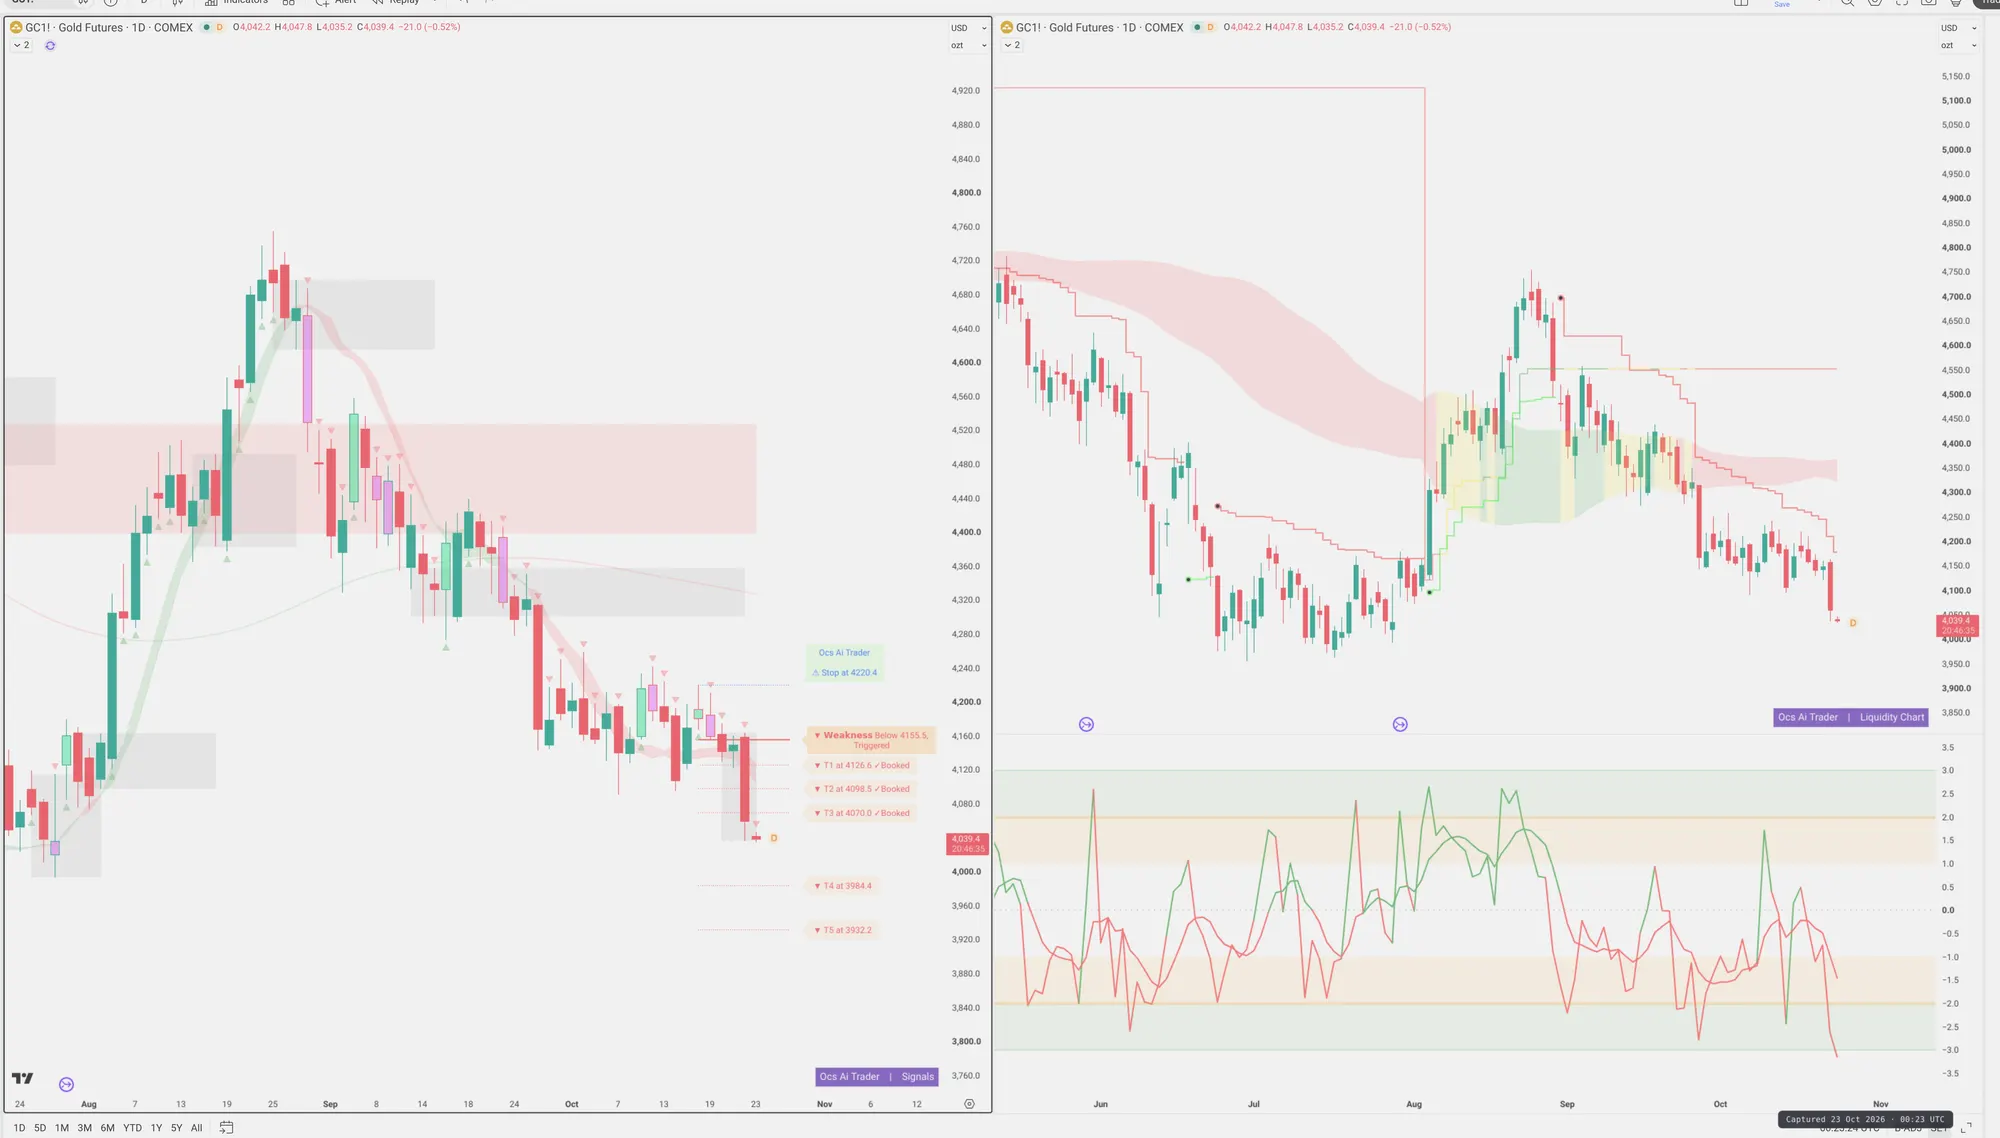
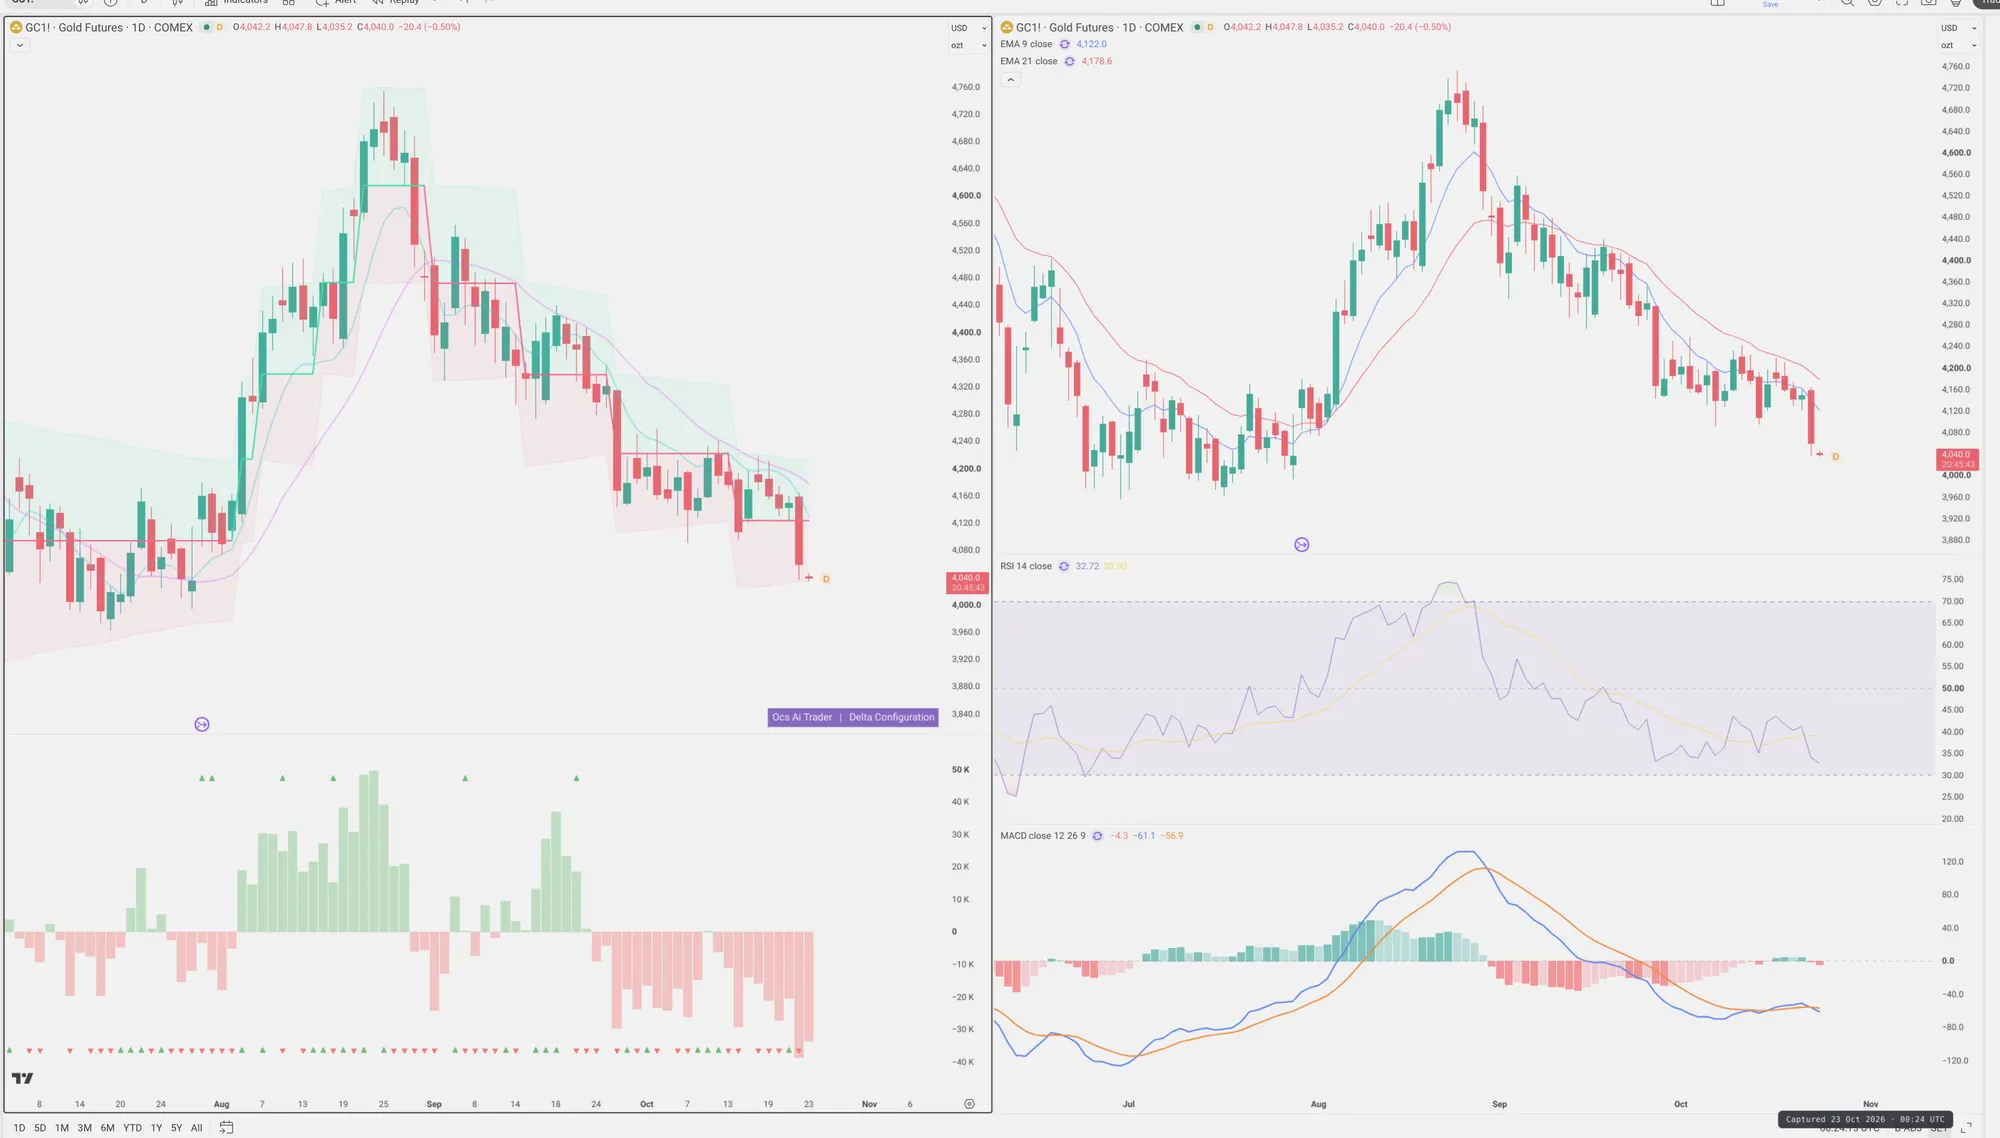
Fig. 3 GC=F — Signals + Liquidity · open full sizeFig. 4 GC=F — Delta + Technical · open full sizeGC=F — Unified OCS chart read
Executive Summary
The consensus outlook is bearish, characterized by a high-conviction trend-continuation short setup. Price is currently navigating a 'Weakness Below' regime (Chart 1) while operating within negative liquidity bands and below both fast and slow negative liquidity lines (Chart 2). The primary confluence is found in the alignment of the pink weakness momentum band (Chart 1) with the negative delta cycle and bearish MACD/RSI readings (Chart 2).
OCS Confluence
Grade
Directional Bias
Participation State
high
bearish
active
Setup Read: The setup presents a bearish trend-continuation profile supported by momentum band alignment and negative liquidity positioning.
Structural momentum: Price is trading within the pink weakness band (Chart 1) and below negative liquidity lines (Chart 2).
Technical indicators: Negative RSI and MACD (Chart 2) support the 'Weakness Below' declaration (Chart 1).
Contradictions
Mixed Delta Force: Recent red delta arrows appearing after green markers (Chart 2) suggest potential absorption, contrasting the clean weakness setup in Chart 1.
Levels To Watch
4220.4 (Catastrophic Stop/Invalidation) [Chart 1]
4185.5 (Trigger Level) [Chart 1]
4178.6 (EMA 21/Structural Resistance) [Chart 2]
4136.6 (Historical Target T1) [Chart 1]
4070.0 (Historical Target T3) [Chart 1]
3984.4 (Next Unbooked Target T4) [Chart 1]
Invalidation
Structural failure occurs upon a price breach above the catastrophic stop at 4220.4 (Chart 1).
Risk Notes
Medium hands-off risk due to price testing lower bounds of the negative liquidity band (Chart 2).
Potential for short-term stalling/absorption evidenced by mixed delta activity (Chart 2).
GC=F — Signals + Liquidity (click to expand)
Visible Context
Symbol
Timeframe
Layout Confidence
GC1! COMEX - Gold Futures
1D
high
Signal Engine
Direction
Declaration
Trigger
Trigger Status
Stop / Invalidation
SHORT
Weakness Below
4185.5
Triggered
4220.4
Target Ladder
T1
T2
T3
T4
T5
Booked
Next Unbooked
4136.6 (Booked)
N/A
4070.0 (Booked)
3984.4
3902.2
T1, T3
T4
Structure Context
Float-Volume Zones
Momentum Band
Dominant Cycle
Price Location
Structural Context
Price is currently rejecting a pink extreme float-volume zone near 4185-4220.
weakness; price is trading within the pink weakness band.
bearish; the pink cycle ribbon is active and trending downward.
Price is below the trigger of 4185.5 and below the booked T1 of 4136.6, currently approaching T4.
The setup is clean as price is respecting the pink weakness band and the dominant cycle alignment.
Setup Read
State
R:R to T1
R:R to Furthest
Invalidation
Evidence Quality
Notes
active
N/A
2.15
Price breach above the catastrophic stop at 4220.4.
high
The declaration of Weakness Below is supported by confluence between the pink momentum band, the pink dominant cycle ribbon, and the rejection of the upper pink float-volume zone.
GC=F — Delta + Technical (click to expand)
OCS Layout Presence
Delta Configuration Badge
Delta Histogram / CVD
Liquidity Overlay / Cycle
Ocs Ai Trader | Delta Configuration visible in the middle-left pane.
Green and red CVD/Delta columns visible at the bottom, with green delta-force arrows and red delta-force arrows above/below the histogram.
Liquidity bands (shades of green/red) and stepped liquidity lines are visible overlaid on the price action.
Liquidity Engine
Active Band
Vs Slow Liquidity
Vs Fast Liquidity
Cycle State
Divergence
Hands-Off Risk
negative, with latest price currently within the red bearish zone.
below slow negative liquidity line.
below fast negative liquidity line.
tangle/convergence within the negative band.
none
medium, due to price testing the lower bounds of the negative liquidity band amidst mixed delta markers.
Delta Engine
CVD Pressure
Dominant Cycle Leader
Adaptive Filter
Delta Force
Exhaustion Boundary
mixed, with recent red columns following a period of green columns.
negative
bearish ceiling
mixed, recent red arrows appearing after previous green arrows.
none
Secondary TA
EMA
RSI
MACD
EMA 21 close at 4,178.6 and EMA 50 close at 4,122.0.
RSI 14 close at 38.72.
MACD 12 26 9 at -4.3.
Confluence
Setup Type
Directional Bias
Conviction
Confirmation
Contradiction
Key Level
trend-continuation short
bearish
medium
Price is trading below both fast and slow negative liquidity lines within a negative liquidity band, supported by negative RSI and MACD.
Recent delta force markers show mixed activity, suggesting potential short-term absorption or stalling.
4,178.6 (EMA 21)
* **Snapshot:** GC=F at $4037.40 (-2.76%); GLD at $369.00 (-2.63%).
* **Analysis:** The capitulation is broad-based. GLD options activity shows heavy volume in near-term puts, indicating institutional positioning for further downside. The failure to hold the 20-day SMA ($4169 for GC=F) is a significant bearish technical development.
* **Risk:** The primary risk to the downside is a continued rise in the US 2Y yield. Any sign of a "dovish pivot" or a cooling in labor data is required to break this correlation.
Silver (SI=F)
Fig. 5 SI=F — Signals + Liquidity · open full sizeFig. 6 SI=F — Delta + Technical · open full sizeSI=F — Unified OCS chart read
Executive Summary
The consensus outlook for SI=F is bearish structural weakness countered by bullish exhaustion signals. While Chart 1 — Signals + Liquidity declares a 'Weakness Below' short setup with price trading below the 54.525 trigger, Chart 2 — Delta + Technical highlights an oversold RSI (39.41) and a 'reversal long' possibility near recent liquidations. The current state is characterized by price navigating a negative liquidity band and a bearish dominant cycle ribbon.
OCS Confluence
Grade
Directional Bias
Participation State
low
bearish
active
Setup Read: SI=F exhibits bearish structural momentum below the 54.525 trigger, though delta and RSI metrics suggest proximity to a technical exhaustion point.
Confirmations
Both charts indicate price is currently in a negative/weakness zone (Pink Ribbon in Chart 1; Negative Liquidity Band in Chart 2).
Price is trading below key momentum and liquidity lines in both analyses.
Contradictions
Chart 1 declares a 'Weakness Below' short setup, whereas Chart 2 identifies a 'reversal long' setup due to oversold RSI/liquidity bottoms.
Chart 1 shows momentum alignment for shorts, while Chart 2 shows mixed Delta force and mixed CVD pressure.
Levels To Watch
54.525 (Short Trigger - Chart 1)
52.780 (T1 Target - Chart 1)
58.415 (Catastrophic Stop - Chart 1)
55.000 (Reversal Long Key Level - Chart 2)
57.008 (EMA 9 - Chart 2)
Invalidation
Structural failure occurs if price crosses above the catastrophic stop of 58.415 (Chart 1).
Risk Notes
Medium hands-off risk due to mixed delta markers and price dropping into the negative zone (Chart 2).
Potential for exhaustion/reversal as RSI enters oversold territory (Chart 2).
SI=F — Signals + Liquidity (click to expand)
Visible Context
Symbol
Timeframe
Layout Confidence
SI=F - Silver Futures · COMEX
D
high
Signal Engine
Direction
Declaration
Trigger
Trigger Status
Stop / Invalidation
SHORT
Weakness Below
54.525
Triggered
58.415
Target Ladder
T1
T2
T3
T4
T5
Booked
Next Unbooked
52.780
51.105
N/A
N/A
N/A
None
52.780
Structure Context
Float-Volume Zones
Momentum Band
Dominant Cycle
Price Location
Structural Context
Price is currently inside a gray average float-volume/order-block zone near 54.525.
weakness; price is trading within the pink weakness band.
bearish; the pink dominant-cycle ribbon is active and trending downwards.
Price is below the trigger of 54.525, below T1 (52.780), and above the stop (58.415).
The setup is clean as price has transitioned into a weakness band with an active negative cycle ribbon and is trading below the trigger level.
Setup Read
State
R:R to T1
R:R to Furthest
Invalidation
Evidence Quality
Notes
active
0.43
0.47
Price crossing above the catastrophic stop at 58.415.
high
The declaration of Weakness Below is supported by alignment between the momentum weakness band and the active pink dominant-cycle ribbon.
SI=F — Delta + Technical (click to expand)
OCS Layout Presence
Delta Configuration Badge
Delta Histogram / CVD
Liquidity Overlay / Cycle
Ocs Ai Trader | Delta Configuration
Green CVD columns (net buying) and red CVD columns (net selling) are present in the lower panel, accompanied by small green/red triangle markers at the bottom edge.
N/A
Liquidity Engine
Active Band
Vs Slow Liquidity
Vs Fast Liquidity
Cycle State
Divergence
Hands-Off Risk
negative
below slow negative liquidity line
below fast negative liquidity line
tangle
none
medium due to recent price drop into the negative zone and mixed delta markers
Delta Engine
CVD Pressure
Dominant Cycle Leader
Adaptive Filter
Delta Force
Exhaustion Boundary
mixed
tangled
bearish ceiling
mixed recent green and red triangle markers
none
Secondary TA
EMA
RSI
MACD
EMA 9 57.008, EMA 21 59.137
RSI 14 close 39.41 (oversold territory)
MACD close 12 26 9 -0.325 -2.158 -1.833
Confluence
Setup Type
Directional Bias
Conviction
Confirmation
Contradiction
Key Level
reversal long
bullish
low
RSI is in oversold territory and price is approaching the bottom of recent liquidations.
Price is currently trading below both fast and slow negative liquidity lines within a negative liquidity band.
55.000
* **Snapshot:** $54.56 (-9.09%).
* **Analysis:** Silver is suffering a double-whammy: it is being dragged down by the gold liquidation and simultaneously hit by concerns over industrial demand deceleration. The 9% drop is a high-beta reaction to the broader macro risk-off sentiment.
* **Risk:** Industrial demand for silver is highly sensitive to the economic slowdown implied by the current "Stagflationary Trap."
Energy Complex (XLE / WTI)
Fig. 7 XLE — Signals + Liquidity · open full sizeFig. 8 XLE — Delta + Technical · open full sizeXLE — Unified OCS chart read
Executive Summary
The consensus direction for XLE is bullish, characterized by a successful trend-continuation phase that has cleared all primary declared targets (Chart 1 — Signals + Liquidity). While the structural regime remains firmly within the green strength and bullish liquidity bands, current participation is transitioning into an exhausted state as price trades above historical targets and encounters mixed delta pressure (Chart 2 — Delta + Technical). The strongest evidence for continued structure is the alignment of fast/slow liquidity lines and the green momentum ribbon providing active support below price.
OCS Confluence
Grade
Directional Bias
Participation State
medium
bullish
exhausted
Setup Read: XLE maintains a bullish structural regime above all primary targets, though recent delta divergence suggests a transition toward an exhausted participation state.
Confirmations
Price is trading within the green strength/liquidity regime (Chart 1 & Chart 2)
Active positive cycle support is present via both ribbons and liquidity lines (Chart 1 & Chart 2)
Structure has successfully cleared all previous declared targets (Chart 1)
Contradictions
Structural momentum remains bullish (Chart 1) while recent CVD columns and delta-force markers show short-term selling pressure (Chart 2)
Structural failure is defined by price crossing below the catastrophic stop at 61.04 (Chart 1 — Signals + Liquidity).
Risk Notes
Exhaustion risk as price resides above all previously booked targets (Chart 1)
Short-term profit-taking signaled by recent red CVD and mixed delta force (Chart 2)
Potential for mean reversion toward the EMA 21/slow liquidity area at 65.75 (Chart 2)
XLE — Signals + Liquidity (click to expand)
Visible Context
Symbol
Timeframe
Layout Confidence
XLE
1D
high
Signal Engine
Direction
Declaration
Trigger
Trigger Status
Stop / Invalidation
LONG
Strength Above
62.77
Triggered
61.04
Target Ladder
T1
T2
T3
T4
T5
Booked
Next Unbooked
63.52 (Booked)
64.44 (Booked)
65.01 (Booked)
67.26 (Booked)
68.63 (Booked)
T1, T2, T3, T4, T5
all booked
Structure Context
Float-Volume Zones
Momentum Band
Dominant Cycle
Price Location
Structural Context
Latest price is in open space, having moved above the blue secondary order block zone.
strength; price is trading within the green strength band.
bullish; green ribbon is providing active positive cycle support below price action.
Price is currently at 65.77, which is above all booked targets and the trigger, but below the current high of the most recent candle.
The setup is clean as price has successfully cleared all declared targets and remains within the strength regime.
Setup Read
State
R:R to T1
R:R to Furthest
Invalidation
Evidence Quality
Notes
exhausted
N/A
N/A
Price crossing below the catastrophic stop at 61.04.
high
All declared strength targets have been achieved, with price maintaining position within the green momentum and cycle ribbons.
XLE — Delta + Technical (click to expand)
OCS Layout Presence
Delta Configuration Badge
Delta Histogram / CVD
Liquidity Overlay / Cycle
Ocs Ai Trader | Delta Configuration
Green and red CVD columns are visible in the bottom panel, accompanied by small green and red delta-force arrows above/below the columns.
Visible liquidity bands (green/red shading) and stepped liquidity lines are present on the main price chart.
Liquidity Engine
Active Band
Vs Slow Liquidity
Vs Fast Liquidity
Cycle State
Divergence
Hands-Off Risk
positive, with price currently trading in the upper portion of the green bullish zone
above slow positive liquidity line
above fast positive liquidity line
fast and slow liquidity lines are in positive alignment
none
low
Delta Engine
CVD Pressure
Dominant Cycle Leader
Adaptive Filter
Delta Force
Exhaustion Boundary
mixed, with recent red columns following a series of green accumulation
positive
bullish floor
mixed, showing both recent green and red arrows
none
Secondary TA
EMA
RSI
MACD
EMA 9: 67.15, EMA 21: 65.75
RSI 14 close: 63.11
MACD close: 12.26, 9: 0.75, 26: 1.34, 1.06
Confluence
Setup Type
Directional Bias
Conviction
Confirmation
Contradiction
Key Level
trend-continuation long
bullish
medium
Price is holding above both fast and slow positive liquidity lines within a bullish liquidity band.
Recent red CVD columns and red delta-force markers suggest short-term selling pressure/profit taking.
65.75 (EMA 21/Slow liquidity area)
* **Snapshot:** XLE at $67.57 (-0.87%); WTI at $3.89 (-2.26%).
* **Analysis:** Despite the geopolitical risk premium, energy equities are struggling to maintain gains, likely due to the broader market liquidity drain and the rotation into defensive staples. The US domestic energy sector (XLE) remains a "hidden beneficiary" in the long term, as it provides a security premium compared to global energy trade routes.
* **Levels to Watch:** XLE support at $66.00; resistance at $69.50.
Emerging Markets (NIFTY)
Fig. 9 NIFTY — Signals + Liquidity · open full sizeFig. 10 NIFTY — Delta + Technical · open full sizeNIFTY — Unified OCS chart read
Executive Summary
The overall regime exhibits a bearish structural bias with a current unclear participation state. While Chart 1 — Signals + Liquidity declares a high-confidence SHORT weakness regime triggered below 22687.65, Chart 2 — Delta + Technical reports mixed CVD pressure and tangled cycles, indicating a lack of decisive directional force at the immediate 22,700 level.
OCS Confluence
Grade
Directional Bias
Participation State
low
bearish
unclear
Setup Read: The setup presents a bearish structural declaration that is currently encountering mixed delta participation and tangled liquidity cycles.
Confirmations
Both charts indicate bearish momentum/cycles (Pink momentum band in Chart 1; Negative MACD/RSI in Chart 2).
Price is currently trading below the key structural trigger of 22687.65 (Chart 1).
Contradictions
Chart 1 shows a high-confidence triggered weakness signal, whereas Chart 2 reports a 'hands-off' neutral stance due to tangled cycles and mixed CVD.
Levels To Watch
23175.25 (Catastrophic Stop - Chart 1)
22687.65 (Short Trigger - Chart 1)
22700.00 (Uncertain Liquidity Band - Chart 2)
22415.55 (T1 Target - Chart 1)
22187.55 (T2 Target - Chart 1)
Invalidation
Structural failure occurs upon a breach of the catastrophic stop at 23175.25 (Chart 1).
Risk Notes
High risk of chop due to price oscillating in an uncertain liquidity band (Chart 2).
Tangled dominant cycles and mixed delta pressure suggest lack of immediate trend conviction (Chart 2).
Price is currently rejecting the lower boundary of a previous volume zone (Chart 1).
NIFTY — Signals + Liquidity (click to expand)
Visible Context
Symbol
Timeframe
Layout Confidence
NIFTY- Nifty 50 Index 1D
1D
high
Signal Engine
Direction
Declaration
Trigger
Trigger Status
Stop / Invalidation
SHORT
Weakness Below
22687.65
Triggered
23175.25
Target Ladder
T1
T2
T3
T4
T5
Booked
Next Unbooked
22415.55
22187.55
21955.45
N/A
N/A
None
22415.55
Structure Context
Float-Volume Zones
Momentum Band
Dominant Cycle
Price Location
Structural Context
Price is currently inside a pink extreme float-volume zone (~22400-22600) and rejecting the lower boundary of the previous gray zone.
weakness; price is trading within the pink momentum weakness band.
bearish; the ribbon is pink and trending downward.
Price is below the trigger of 22687.65, moving toward T1 at 22415.55, with a catastrophic stop at 23175.25.
The setup shows high confluence with price trading inside a weakness momentum band, a negative dominant cycle, and an extreme float-volume zone.
Setup Read
State
R:R to T1
R:R to Furthest
Invalidation
Evidence Quality
Notes
active
N/A
N/A
Price breach of the catastrophic stop at 23175.25.
high
The structural alignment of the pink momentum band, pink dominant cycle, and triggered weakness declaration suggests a cohesive downside regime.
NIFTY — Delta + Technical (click to expand)
OCS Layout Presence
Delta Configuration Badge
Delta Histogram / CVD
Liquidity Overlay / Cycle
Ocs Ai Trader | Delta Configuration badge is visible in the center of the chart panel.
Visible CVD/Delta histogram at the bottom with green/red bars and small indicator markers (A/V symbols) above/below the histogram.
Visible liquidity bands and cycle lines integrated into the price action and bottom panel.
Liquidity Engine
Active Band
Vs Slow Liquidity
Vs Fast Liquidity
Cycle State
Divergence
Hands-Off Risk
uncertain liquidity band, with price currently oscillating within a transition zone near the 22,700 level.
at slow positive liquidity line
at fast positive liquidity line
tangle
none
high, due to uncertain liquidity band and tangled cycle lines.
Delta Engine
CVD Pressure
Dominant Cycle Leader
Adaptive Filter
Delta Force
Exhaustion Boundary
mixed, recent columns show alternating small green and red accumulation/distribution.
tangled
mixed
mixed, recent markers show a sequence of small green and red symbols.
none
Secondary TA
EMA
RSI
MACD
EMA 9 close: 22,760.60, EMA 21 close: 22,679.28
RSI 14 close: 43.96
MACD close 12 26 9: -167.07 / -235.92
Confluence
Setup Type
Directional Bias
Conviction
Confirmation
Contradiction
Key Level
hands-off
neutral
low
N/A
Price is caught in an uncertain liquidity band with tangled dominant cycles and mixed CVD pressure.
22,700
* **Snapshot:** NIFTY is facing significant FII outflow pressure.
* **Analysis:** The combination of a strong DXY and rising energy costs creates a classic "margin squeeze" for Indian equities. HDFCB and other financials are particularly vulnerable to the potential for RBI tightening to defend the INR.
Historical Parallels
We are seeing echoes of the 1970s stagflationary environment, specifically the period where energy supply shocks (the 1973 oil crisis) forced the Fed into a restrictive posture that initially overwhelmed the "inflation hedge" narrative for precious metals. In late 1974, gold experienced significant volatility-driven liquidation before establishing a structural floor. Investors should look to the 2022 energy-shock period for the most recent template of how "safe-haven" assets can decouple from geopolitical events when real-rate pressures dominate.
Outlook & Risk Matrix
Short-Term (1-5 Days)
Base Case: Continued volatility in precious metals as the market digests the "Stagflationary Trap." Expect gold to trade in a wide range, testing the $4000 handle.
Bull Case: A sudden, sharp decline in US 2Y yields or a cooling labor print, which would allow the geopolitical risk premium to re-assert itself.
Bear Case: A "breakdown" scenario where gold fails to hold $4000, triggering further systematic liquidation and a move toward the $3900 level.
Medium-Term (1-4 Weeks)
Structural View: The energy supply chain risk premium is likely to remain elevated due to the Suez/Red Sea bottlenecks. This will keep inflation expectations anchored at a higher level than the market currently discounts, forcing the Fed to maintain a restrictive stance. This environment is inherently challenging for gold but supportive of energy infrastructure and defensive staples.
What to Watch
US 2Y Yields: The primary anchor for the gold/real-rate correlation. If yields continue to climb, gold's capitulation will likely persist.
Red Sea/Suez Transit Data: Any further escalation in the Egypt-Yemen-Saudi dynamic will increase the "permanent" risk premium on energy, feeding the stagflationary loop.
DXY Strength: A sustained break above 105 in the DXY will continue to act as a liquidity headwind for all non-USD assets, particularly EM equities (NIFTY).
Institutional ETF Flows: Monitor GLD and SLV outflows. A reversal in these flows would be the first sign of a bottoming process.
Education and market research only, not financial advice. Charts are OCS AI Trader readings at the time of writing and change with new bars.