The Liquidity Paradox: Why Precious Metals are Collapsing Amid Geopolitical Risk
Executive summary
The financial markets are currently gripped by a "Liquidity Paradox." While escalating geopolitical instability in the Strait of Hormuz—stemming from Iranian attacks on shipping—would traditionally trigger an immediate, reflexive flight-to-safety into precious metals, the opposite is occurring. We are witnessing a violent, forced liquidation of gold and silver futures. This is not a rejection of the fundamental safe-haven thesis; rather, it is a symptom of a broader, systemic deleveraging event. As institutional portfolios face margin calls in the equity and semiconductor complex (NQ/SMH), managers are liquidating their most liquid assets—gold and silver ETFs and futures—to raise cash. This "Liquidity Trap" is creating a temporary, yet severe, decoupling of precious metals from their fundamental safe-haven role.
The Cascading Impact Chain
Layer 1: Direct Impacts (The Trigger)
The immediate catalyst is the sharp escalation of conflict in the Persian Gulf. Iranian maritime attacks on shipping infrastructure have introduced a tangible supply-side risk premium into the energy complex.
- Energy Shock: WTI and BRENT are rallying on the fear of a prolonged supply chain disruption.
- Safe-Haven Reflex: While the narrative of a safe-haven bid for XAU and GC remains, the execution has been inverted. Instead of buying metals, the market is facing a "sell what you can" environment.
- Volatility Spike: The rapid repricing of geopolitical risk has forced a broad-based risk-off sentiment, hitting the ES and NQ futures complex immediately.
Layer 2: Secondary Effects (The Ripple)
The direct shock is cascading into sector-specific pain points:
- Input Cost Inflation: The surge in energy prices (XLE) is creating an input-cost squeeze for downstream industries. This is particularly punishing for the semiconductor sector (SMH, NVDA), which is energy-intensive.
- Deleveraging Dynamics: As tech valuations compress under the weight of risk-off sentiment and margin calls, the "growth-sensitive" assets are dumping. This is the mechanism triggering the liquidity drain.
- Currency Flight: The DXY is strengthening as a global reserve currency, which, counter-intuitively, is acting as a headwind for non-yielding assets like gold, as the dollar becomes the primary funding currency for the deleveraging trade.
Layer 3: Macro Propagation (The Ripple)
We are observing a fundamental divergence in the precious metals complex:
- Gold vs. Silver: Gold is benefiting from a relative flight-to-quality, but Silver (SI=F) is being hit significantly harder (-20.76%). This is due to its dual nature as a monetary metal and an industrial input. Fears of a manufacturing contraction, coupled with supply chain disruptions, are stripping away silver's industrial premium.
- Real-Rate Paradox: While energy inflation (BRENT/WTI) typically raises inflation expectations, the market is currently prioritizing liquidity over inflation hedging. The "real-rate" argument for gold is temporarily dormant, subordinated to the raw need for cash.
Layer 4: Non-Obvious Cross-Connections (The Liquidity Trap)
The most critical insight is the "Liquidity Trap" deleveraging loop. In previous cycles, gold would rally during such geopolitical shocks. Today, the institutional ownership structure has changed. Large-scale funds, heavily exposed to the AI/Semiconductor boom (SMH/NVDA), are facing margin calls. Because gold (GLD/GC) is one of the most liquid, non-correlated assets in their portfolio, it is being used as the "ATM" to fund these margin calls. This creates a temporary, inverse correlation between geopolitical risk and gold/silver prices.
Unified OCS Chart Read
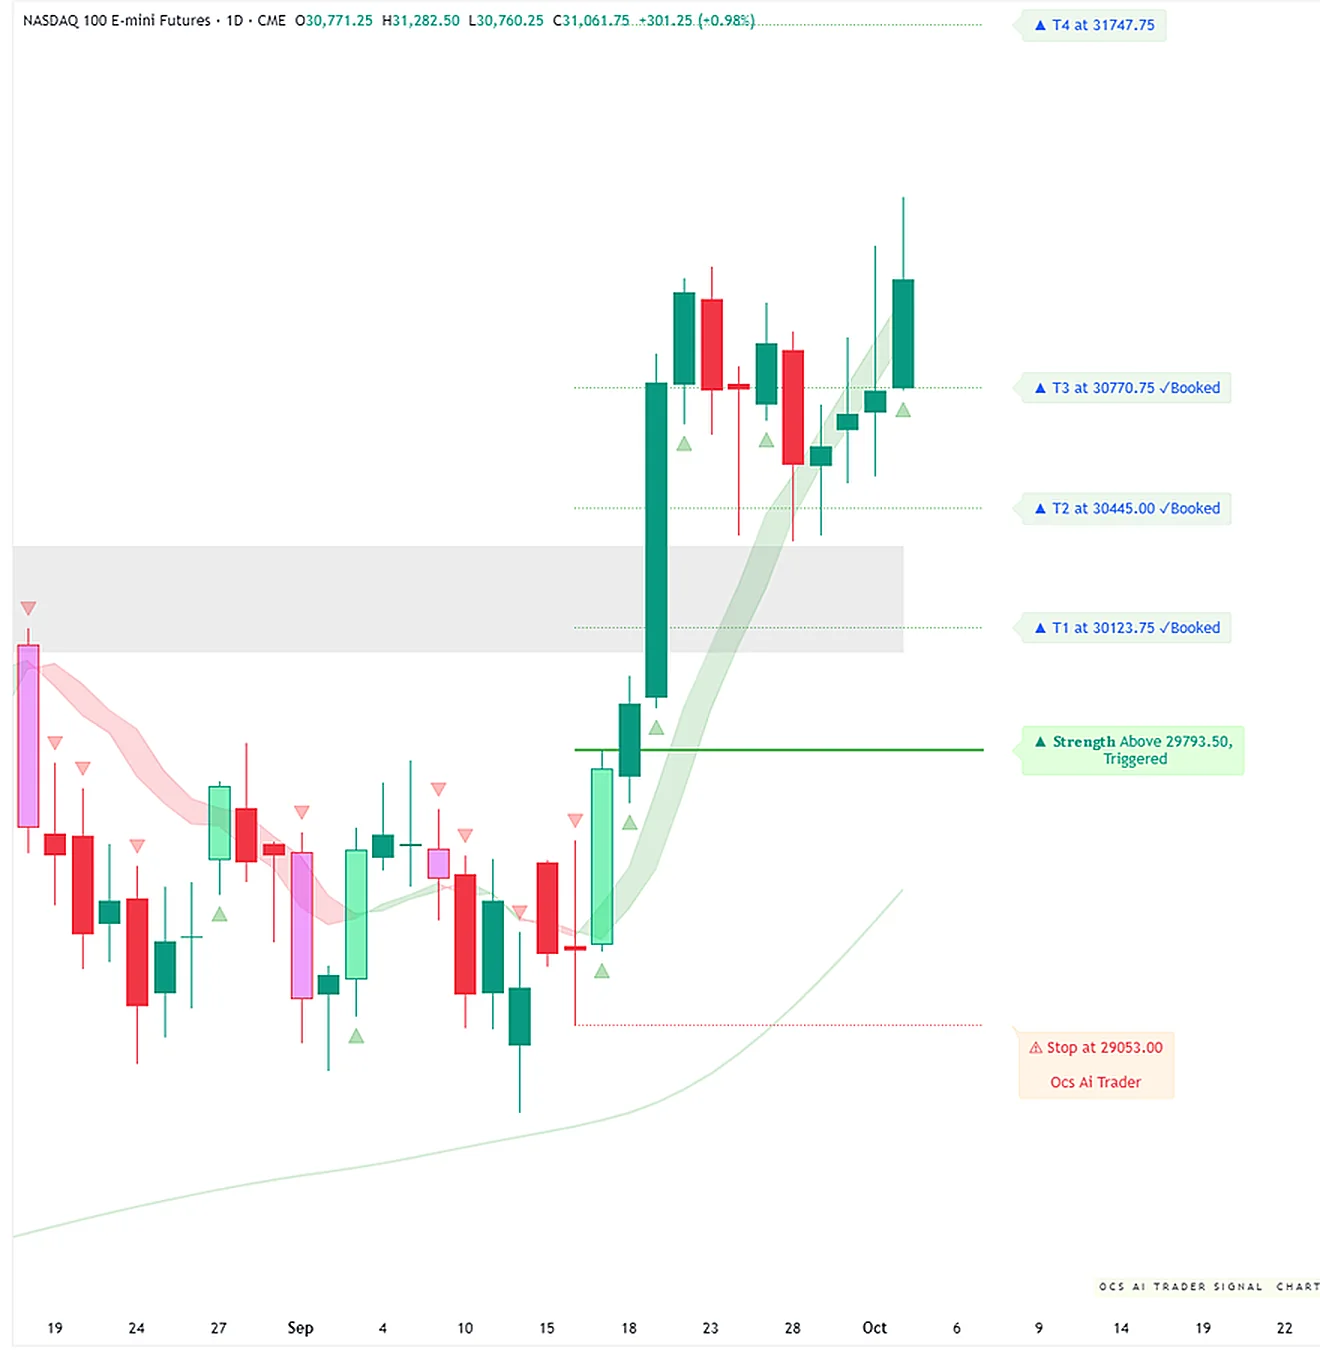
Note: Chart capture is currently deferred to the async repair queue. The following analysis is based on the provided market data and technical indicators.
Setup Read: The technicals for GC=F and SI=F are currently in a state of "forced liquidation."
- GC=F: With a 10.24% daily drop, the asset has broken below its 20d and 50d SMAs. The RSI at 41.47 suggests the asset is not yet "oversold" in the traditional sense, but in a "cascading" sense.
- SI=F: The 20.76% collapse is extreme. The RSI at 37.84 confirms the severity of the sell-off. The Bollinger Band breakdown (price is below the lower band) indicates a volatility expansion to the downside.
- GLD/SLV: The ETFs are showing less volatility than the futures, suggesting that retail and institutional ETF holders are holding firmer than the futures-market speculators, or that ETF liquidity is being managed differently.
Levels to Watch:
- GC=F: The $3910 level (Lower Bollinger Band) is the immediate support. A failure to hold here risks a move toward the 200d SMA, though data for the 200d is currently N/A.
- SI=F: The $48.29 level (Lower Bollinger Band) is the critical defensive line.
- Confirmation/Contradiction: The news (geopolitical risk) is fundamentally bullish for gold, but the price action is bearish. This is a classic "contradiction" setup caused by liquidity, not fundamentals. Until the NQ/ES margin call pressure subsides, the chart signals should be treated as "hands-off" for long-term thesis positioning.
Security-by-Security Analysis
1. GC=F (Gold Futures)
- Current Price: $3986.20 (-10.24%)
- Analysis: The price action is dominated by margin-call liquidation. The decline from the $4441 previous close represents a violent repricing. The lack of options data suggests a thin market or a rapid shift in hedging strategies.
- Risk Note: The primary risk is further forced liquidation if the NQ/ES futures continue to slide.
2. SI=F (Silver Futures)
- Current Price: $51.33 (-20.76%)
- Analysis: Silver is suffering a "double-whammy." It is being sold for liquidity (like gold) and sold for industrial demand concerns (due to the supply chain issues). The 20% drop is a capitulation-style move.
- Risk Note: Silver's industrial sensitivity makes it significantly higher-beta than gold in this environment.
3. GLD (SPDR Gold Shares)
- Current Price: $365.17 (-1.13%)
- Analysis: GLD is holding up remarkably well compared to the futures contract. This suggests that the "Liquidity Trap" is primarily impacting the futures market (speculators/institutions) rather than the physical-backed ETF holders.
- Options Activity: High volume in the $345-$348 strike range for calls suggests some institutional positioning for a rebound, but the IV (600%+) indicates massive uncertainty and fear.
4. SLV (iShares Silver Trust)
- Current Price: $46.65 (+0.37%)
- Analysis: Unlike the futures market, SLV is actually showing resilience. This decoupling between the futures price (SI=F) and the ETF price (SLV) is a key anomaly to watch. It suggests a potential dislocation between paper silver and physical-backed silver.
5. XLE (Energy Select Sector SPDR)
- Current Price: $63.37 (+1.86%)
- Analysis: XLE is the clear beneficiary of the current chaos. As the geopolitical risk premium is priced into energy, XLE acts as the hedge for the inflationary side of this trade.
Historical Parallels
We have seen this "Liquidity Paradox" before. In October 2008, as the Global Financial Crisis accelerated, gold initially fell sharply alongside equities as investors liquidated everything to meet margin calls and hoard cash. It was only after the initial deleveraging wave subsided that gold began its multi-year bull run. Similarly, in March 2020, gold saw a sharp, violent drop as the market panicked, before rallying aggressively as the Fed stepped in. The lesson: Liquidity events are temporary; fundamental drivers are permanent.
Outlook & Risk Matrix
Short-Term (1-5 Days): Volatility & Deleveraging
- Outlook: Bearish/Volatile. The market is in the "margin call" phase. Expect continued pressure on precious metals as long as the NQ/ES complex is under stress.
- Scenarios:
- Base Case: Continued volatility in metals as the liquidity drain persists.
- Bull Case: A stabilization in the DXY and a pause in the NQ/ES sell-off, allowing gold to decouple and reassert its safe-haven status.
- Bear Case: A further "crash" in tech equities forces a secondary wave of liquidation in gold/silver.
Medium-Term (1-4 Weeks): The Return of the Fundamental Thesis
- Outlook: Bullish. Once the forced liquidation phase ends, the fundamental drivers—geopolitical risk, energy-driven inflation, and the potential for a dovish Fed pivot to address the liquidity crisis—will likely reassert themselves.
- Key Levels to Watch:
- DXY: If the dollar index cools off, the pressure on gold will evaporate.
- Real Yields: If the energy shock forces the Fed to reconsider its hawkish stance, real yields will fall, providing a massive tailwind for gold.
What to Watch
- The Basis Trade: Watch the spread between GC=F and GLD. If they continue to diverge, it indicates a dislocation in the market that may signal the end of the liquidity-driven sell-off.
- DXY Strength: The dollar is the "funding currency" for this deleveraging. A peak in DXY is a prerequisite for a bottom in precious metals.
- Semiconductor Volatility: Keep a close eye on SMH and NVDA. If these stabilize, the margin call pressure on the broader market (and by extension, the gold futures market) will alleviate.
- Hormuz Headlines: Any de-escalation in the Strait of Hormuz will reduce the energy risk premium, which could lower inflation expectations and change the macro narrative for gold.
Education and market research only, not financial advice. Charts are OCS AI Trader readings at the time of writing and change with new bars.