The Khor Mor-Aramco Pivot: Energy Supply Shock Resets Global Macro Risk
The energy-first macro regime is no longer a theoretical risk; it is the realized state of play. As of Monday, November 9, 2026, the suspension of production at Iraq’s Khor Mor gas field, combined with concurrent Houthi attacks on Aramco infrastructure, has triggered a structural supply shock that is forcing an immediate repricing of global risk.
We are witnessing a violent decoupling of energy commodities from broader equity valuations. While traditional models might suggest a "risk-off" environment, the specific mechanism here is a cost-push inflationary shock that creates a liquidity trap for energy-intensive industrials and a margin-compression nightmare for the broader indices. The futures market is reacting with extreme velocity: CL=F is up 15.73%, and NG=F has surged 13.11%, while equity futures (ES=F, NQ=F, RTY=F) are gapping down as the market aggressively reprices the cost of doing business in a high-energy-cost environment.
The Layered Impact Chain
To understand the current market dislocation, we must trace the causal chain from the initial kinetic event to the structural liquidity shifts occurring in the futures markets.
Layer 1: Direct Impacts (Supply Shock)
The immediate catalyst is the suspension of the Khor Mor gas field due to drone attacks. This is not merely a regional disruption; it is a direct hit to the supply chain of a key energy-producing node in the Kurdistan region. Simultaneously, the Houthi attacks on Aramco infrastructure have introduced an immediate geopolitical risk premium into the global crude complex.
- CL=F (WTI Crude): The 15.73% surge indicates a massive short-covering event and a rapid repricing of the term structure. We are seeing a move toward backwardation as the market fears immediate physical supply shortages.
- NG=F (Natural Gas): The 13.11% spike reflects the loss of Khor Mor’s output, which is a critical source of regional gas supply, forcing a scramble for alternative sources and triggering a global LNG substitution bid.
Layer 2: Secondary Effects (Sectoral Ripple)
The shock is not confined to the energy sector. We are seeing immediate margin compression in energy-intensive industries.
- Industrial/Manufacturing: Firms with high energy inputs are seeing their forward-looking margin guidance evaporate. This is particularly acute in the Indian market (NIFTY/RELIANCE), where energy imports are a primary driver of the current account deficit (CAD).
- Equity Indices (ES/NQ/RTY): The sell-off in ES=F (-4.97%) and NQ=F (-9.71%) is a direct function of the "energy tax" on corporate earnings. As input costs rise, the discount rates applied to future cash flows are being adjusted upward, compressing valuation multiples.
- Safe-Haven Rotation: Capital is fleeing risk-on assets and rotating into gold and long-duration Treasuries, though the correlation between these assets is currently under stress due to the inflationary nature of the supply shock.
Layer 3: Macro Propagation (The Feedback Loops)
The shock propagates through the global financial system via three primary channels:
- LNG-Substitution Feedback Loop: The Khor Mor suspension forces European and Asian buyers to bid up global LNG prices. This draws U.S. natural gas supply away from domestic markets, creating a supply-side bid for NG that will persist even if the regional conflict de-escalates. We are effectively tethering Henry Hub to global geopolitical risk premiums.
- Refining Margin "Double-Dip": Integrated energy majors (XLE) are the primary beneficiaries. While WTI prices rise, the crack spreads (the difference between crude input costs and refined product prices) are widening due to logistics disruptions. This creates a "double-dip" benefit for the energy sector while compounding the cost pressure on consumers.
- USDINR/FII Liquidity Trap: For emerging markets like India, the combination of rising oil prices and risk-off sentiment is catastrophic. The widening CAD forces the RBI to defend the currency, tightening domestic liquidity. This is a classic liquidity trap: the market sells NIFTY to raise cash, which forces further currency depreciation, leading to more FII outflows.
Layer 4: Non-Obvious Cross-Connections
The most critical, yet overlooked, connection is the "Semiconductor-Energy" Cost Squeeze. Semiconductor manufacturing (SMH, NVDA, TSM) is incredibly energy-intensive. While the market continues to price these equities on high-growth AI multiples, the reality is that a sustained spike in NG/WTI prices creates an unpriced input-cost headwind. If energy prices remain elevated, we should expect downward revisions in semiconductor margin forecasts, a variable the current growth-focused tape is not yet fully discounting.
Futures Market Mechanics: The Tape
The overnight globex action has been defined by a liquidity vacuum. With volume in ES=F at 25,093 and NQ=F at 20,579, the market is thin and prone to gap-risk.
- ES=F (S&P 500 Futures): The price action at $7393.00, well below the 20-day SMA of 7673.48, confirms a breakdown of the short-term trend. The RSI(14) at 34.02 suggests we are approaching oversold territory, but with the MACD firmly in negative territory (-79.22), there is no immediate signal for a mean-reversion trade.
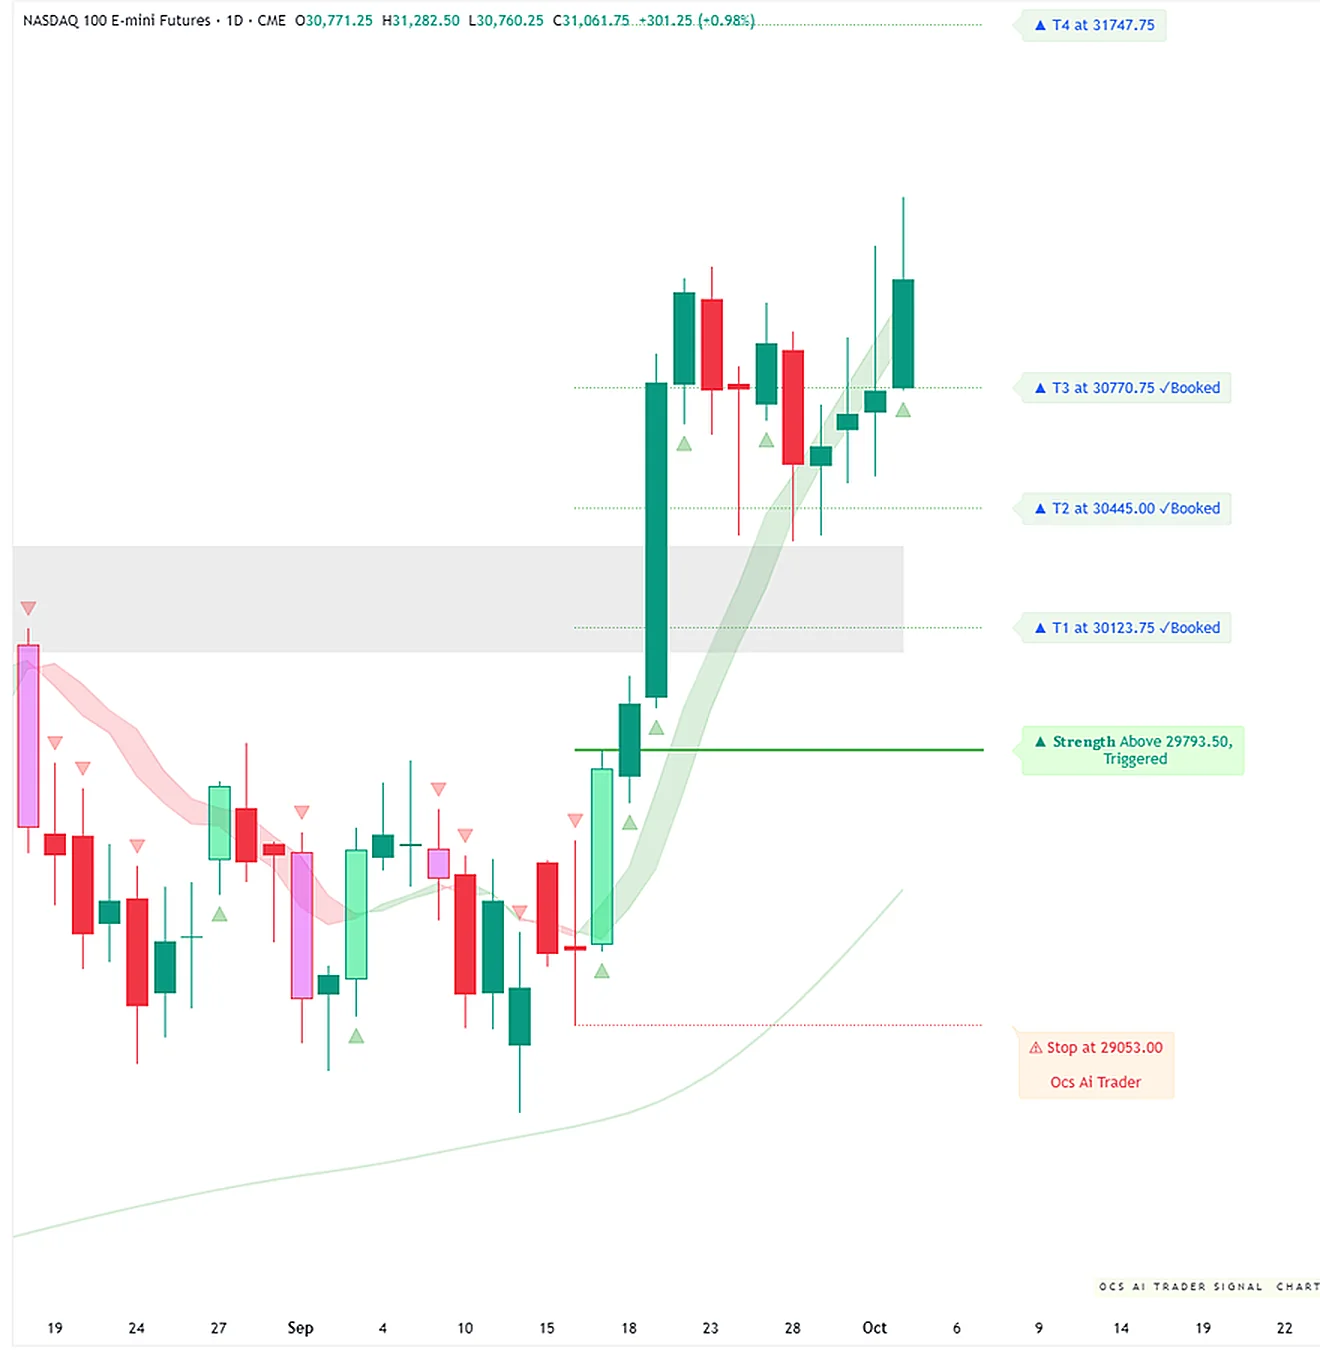
- NQ=F (Nasdaq-100 Futures): The 9.71% drop is the most telling signal of the day. The index is trading at $26,937.25, hovering just above the lower Bollinger Band ($26,838.20). This is a warning sign of a potential liquidity trap where institutional selling is hitting a market with insufficient buy-side depth.
- CL=F (WTI Crude): The move to $90.48 is a technical breakout. With the price now trading above the 20-day SMA ($97.85 is the resistance, but price is pushing upward), the momentum is heavily bullish. The lack of significant volume on this move suggests the market is in a "price discovery" phase, which is inherently volatile.
Unified OCS Chart Read
Note: OCS chart evidence is currently pending asynchronous enrichment. The following analysis is derived from the provided market data and technical indicators.
Technical Setup:
- ES/NQ/RTY: All three indices are showing a clear "breakdown" pattern. The price is significantly below the 20-day and 50-day moving averages. The RSI is trending toward 30, which often signals an oversold condition, but in a supply-shock environment, RSI can remain suppressed for extended periods.
- CL/NG: The energy complex is in a "breakout" mode. The rapid price appreciation is testing the upper limits of the Bollinger Bands.
- XLE: The energy ETF is showing resilience relative to the broader market, though it is not yet fully capturing the magnitude of the crude move, suggesting that the "Refining Margin" thesis is still being priced in.
Confirmation/Contradiction: The thesis of a supply-shock-driven equity sell-off is confirmed by the divergence between energy futures (CL/NG) and equity indices (ES/NQ). The market is clearly rotating out of high-beta growth and into inflation hedges. The lack of options volume data for the indices suggests that the current move is driven by cash-market selling and futures liquidation rather than a systematic hedging event.
Security-by-Security Analysis
XLE (Energy Select Sector SPDR)
- Status: The primary beneficiary of the refining margin expansion.
- Levels to Watch: $62.40 (Day High) acts as immediate resistance. A break above this would suggest the market is fully pricing in the "crack spread" expansion.
- Risk: If the geopolitical premium evaporates due to a swift ceasefire or diplomatic intervention, XLE is vulnerable to a rapid mean reversion.
NIFTY (India Index)
- Status: Under significant pressure due to the USDINR liquidity trap.
- Levels to Watch: The index is facing a dual headwind of FII outflows and rising energy input costs. Watch the USDINR exchange rate as a proxy for NIFTY liquidity; if the currency weakens further, expect continued selling pressure.
- Risk: The "liquidity trap" scenario implies that even if the NIFTY looks technically oversold, the macro-driven outflows may override technical support levels.
WTI Crude (CL=F)
- Status: Leading the market.
- Levels to Watch: The $90.00 psychological level is now support. The resistance is the previous structural high.
- Risk: Overshoot risk is high. When crude moves 15% in a single session, the "volatility of volatility" increases, leading to wider bid-ask spreads and potential slippage for traders.
NG (Natural Gas Futures)
- Status: Structurally bid due to the LNG-substitution feedback loop.
- Levels to Watch: $3.04 (Day High). A sustained break above this level confirms the decoupling from domestic weather forecasts and the transition to a geopolitical-risk-driven price regime.
Historical Parallels
The current situation mirrors the 2019 Abqaiq–Khurais attack, where a sudden supply shock to Saudi infrastructure forced a rapid, albeit temporary, repricing of the global energy complex. However, the current environment is distinct because of the concurrent Khor Mor gas field suspension. We are dealing with a dual-commodity shock (oil and gas) in a macro environment where central banks (specifically the Fed) have less room to maneuver due to sticky inflation. The 2019 event saw a quick spike and a slow decay; the current event, due to the structural "LNG-Substitution" feedback loop, may have a "higher-for-longer" price profile.
Outlook & Risk Matrix
Short-Term (1-5 Days)
- Scenario: High volatility, liquidity fragmentation. We expect the equity indices to remain under pressure as the market digests the "energy tax" on earnings.
- Key Levels: Monitor the $7300 level on ES=F. A break below this would signal a capitulation event.
- Action: Watch for stabilization in the bond market (TLT). If TLT sells off alongside equities, it confirms that the market is pricing in stagflationary fears, not just a temporary supply shock.
Medium-Term (1-4 Weeks)
- Scenario: Sector rotation. The market will likely bifurcate. Energy and defensive sectors will outperform, while high-growth tech and energy-intensive manufacturing will face continued valuation compression.
- Key Levels: Monitor the term structure of WTI. If the market moves deeper into backwardation, it signals that the physical shortage is expected to persist.
- Risk: The biggest risk is a "policy error" where central banks attempt to combat the supply-side inflation with demand-side rate hikes, which would exacerbate the liquidity trap in emerging markets and potentially trigger a broader systemic event.
What to Watch
- Term Structure: Watch the spread between front-month and back-month WTI futures. A steepening backwardation is the "canary in the coal mine" for physical supply tightness.
- USDINR: This is the barometer for EM liquidity. If the RBI fails to stabilize the currency, expect a contagion effect across other emerging market indices.
- Semiconductor Margins: Monitor any guidance updates from chip foundries. If they begin to mention "rising energy costs" as a material factor, the "Semiconductor-Energy" squeeze thesis will be validated.
- Geopolitical Headlines: Any sign of the Khor Mor field coming back online or a cooling of Houthi rhetoric will be the trigger for a violent mean reversion in the energy complex. Stay alert to the "headline risk" premium that is currently embedded in every tick of CL=F and NG=F.
Education and market research only, not financial advice. Charts are OCS AI Trader readings at the time of writing and change with new bars.