The Liquidity Black Hole: Nasdaq Correction and the Great Deleveraging
The market has entered a phase that seasoned traders know all too well: the "Liquidity Black Hole." As of Friday, November 6, 2026, the Nasdaq Composite’s descent into formal correction territory—a decline exceeding 10% from recent highs—is no longer merely a valuation adjustment. It has morphed into a structural deleveraging event. The narrative of the "AI-trade" and "crypto-as-digital-gold" has been abruptly replaced by the harsh reality of margin calls and the exhaustion of retail liquidity buffers.
We are witnessing a recursive selling loop. Retail traders, who fueled the post-election rally, are now dumping positions at the fastest rate since the 2020 COVID sell-off. This isn't just a rotation; it is a forced liquidation. When the liquidity in NQ=F and ES=F dries up, the market becomes reflexive, creating a feedback loop where volatility spikes, triggering further margin calls, which in turn forces more liquidation.
The Cascading Impact: A Layered Analysis
To understand today’s market, we must look beyond the ticker tape and trace the causal chains that are driving this volatility.
Layer 1: The Direct Liquidation (Retail Capitulation)
The primary driver today is the forced liquidation of retail-heavy tech portfolios. NQ=F has seen a massive drawdown, with prices plummeting to $26,566.75, a 10.29% drop. This isn't just institutional rebalancing; it is the systematic unwinding of retail stop-loss orders. As these positions are liquidated, the "AI-beta" premium—the valuation cushion that NVDA and TSM enjoyed—has evaporated. The direct consequence is a liquidity vacuum in equity futures, where market makers are widening bid-ask spreads to compensate for the extreme inventory risk.
Layer 2: The Secondary Contagion (Volatility and Crypto)
The secondary effect is the decompression of the volatility risk premium. Despite the market remaining in a contango regime, the speed of the sell-off has forced VXX and UVXY to surge (UVXY +45.38%). This is a classic "volatility trap." As realized volatility spikes, institutional hedging desks are forced to buy protection, which pushes VIX futures higher, further pressuring the equity index.
Simultaneously, we are seeing the "Crypto-Equity Liquidity Feedback Loop." In previous bull markets, crypto acted as an uncorrelated asset. Today, it is acting as a 24/7 liquidity buffer. As NQ=F margin calls hit, retail investors are liquidating their Bitcoin (BTC) and Solana (SOL) holdings to cover equity deficits. This forces crypto prices down, triggering automated liquidations in crypto-linked portfolios, which necessitates further equity selling to stabilize overall margin requirements.
Layer 3: Macro Propagation (The Global Drain)
The contagion has crossed borders. The "Indian IT ADR Liquidity Drain" is a prime example of macro propagation. FIIs (Foreign Institutional Investors) facing margin calls on their high-beta US tech (NQ=F) holdings are liquidating their most liquid emerging market proxies—Indian IT exporters like INFY and TCS. This creates a double-hit: it pressures the Indian Rupee (USDINR) and forces a valuation re-rating of Indian tech, which in turn reduces global risk appetite for emerging market tech, creating a self-reinforcing negative feedback loop.
Layer 4: The Non-Obvious Connections (The Liquidity Black Hole)
The most dangerous element here is the potential for a "Liquidity Black Hole." The combination of retail-driven gamma unwinding and institutional deleveraging has created a environment where order books are too thin to support large institutional rebalancing. We are seeing a divergence in "Safe Havens": while GLD and TLT are benefiting from risk-off flows, XLE is acting as a hedge against the geopolitical (Iran) component of the sell-off. The divergence occurs when rising energy prices (XLE) begin to pressure inflation expectations, potentially capping the upside for TLT despite the equity sell-off. This is the "Fiscal Gridlock Paradox" in action—markets are pricing in political stalemate as the new status quo, but the energy sector is pricing in a geopolitical risk premium that the rest of the market is ignoring.
Unified OCS Chart Read
Setup Read: The technical setup across NQ=F and ES=F is in a state of "Extreme Oversold/Liquidity Stress."
NQ=F: RSI(14) at 25.89 confirms deep oversold conditions. The MACD is deeply negative (-633.05), indicating strong bearish momentum. The price is trading well below the 20-day Bollinger Band (Lower 27369.15), suggesting the sell-off has decoupled from standard volatility bands.
ES=F: RSI(14) at 31.82 shows similar distress. The market is testing the lower boundaries of its recent range.
Confirmation/Contradiction: The technicals confirm the "Liquidity Black Hole" thesis. The lack of volume participation at lower levels (relative to the massive price drop) suggests a lack of institutional "buy-the-dip" conviction, confirming that the current move is driven by forced liquidation rather than fundamental repricing.
Risk Notes: The setup is "Hands-Off" for trend-following strategies. The volatility (VXX/UVXY) is high, meaning any position sizing must be drastically reduced to account for the wider bid-ask spreads and the potential for flash-crash liquidity gaps.
Security-by-Security Analysis
NQ=F (Nasdaq 100 Futures)
Fig. 1 NQ=F — Signals + Liquidity · open full sizeFig. 2 NQ=F — Delta + Technical · open full sizeNQ=F — Unified OCS chart read
Executive Summary
The consensus direction is Bearish, driven by a high-confidence 'Weakness Below' declaration (Chart 1 — Signals + Liquidity) and sustained net selling pressure (Chart 2 — Delta + Technical). While price has already cleared T1 and T2 targets, it is currently testing the extreme lower boundary of a negative liquidity band, suggesting a battle between established bearish momentum and potential technical exhaustion. The strongest confluence is found in the alignment of the declining pink dominant cycle ribbon (Chart 1) and the diverging downward liquidity lines (Chart 2).
OCS Confluence
Grade
Directional Bias
Participation State
medium
bearish
active
Setup Read: The NQ=F setup maintains a bearish structural bias with price trending toward T3, though it is currently encountering extreme negative liquidity and oversold technical conditions.
Confirmations
Dominant cycle ribbons and liquidity lines are both sloping/diverging downwards (Chart 1 & Chart 2).
Price remains within the pink momentum weakness band (Chart 1) while exhibiting negative delta force (Chart 2).
26000 (Reversal Support - Chart 2 — Delta + Technical)
26128.13 (EMA 9 - Chart 2 — Delta + Technical)
Invalidation
Structural failure is defined by price crossing above the catastrophic stop at 29794.25 (Chart 1 — Signals + Liquidity).
Risk Notes
Medium hands-off risk due to price testing extreme negative liquidity boundaries (Chart 2 — Delta + Technical).
Potential for mean reversion/exhaustion as RSI 14 is in deep oversold territory (Chart 2 — Delta + Technical).
NQ=F — Signals + Liquidity (click to expand)
Visible Context
Symbol
Timeframe
Layout Confidence
NQ1! NASDAQ 100 E-mini Futures
D
high
Signal Engine
Direction
Declaration
Trigger
Trigger Status
Stop / Invalidation
SHORT
Weakness Below
28335.50
Triggered
29794.25
Target Ladder
T1
T2
T3
T4
T5
Booked
Next Unbooked
27536.90 (Booked)
26858.50 (Booked)
24171.25
N/A
N/A
T1, T2
T3
Structure Context
Float-Volume Zones
Momentum Band
Dominant Cycle
Price Location
Structural Context
Price is currently rejecting a red/pink extreme float-volume zone near 27,500 and moving through a gray average float-volume reference zone.
weakness; price is currently trading within the pink momentum weakness band.
bearish; the pink ribbon is sloping downwards below the price action.
Price is below the trigger (28335.50), has cleared booked targets T1 and T2, and is currently trending toward T3 (24171.25).
The setup is clean as price is maintaining position within the pink weakness momentum band and below the dominant cycle ribbon.
Setup Read
State
R:R to T1
R:R to Furthest
Invalidation
Evidence Quality
Notes
active
N/A
N/A
Price crossing above the catastrophic stop at 29794.25.
high
The bearish declaration is supported by price action within the pink momentum weakness band and a declining pink dominant-cycle ribbon.
NQ=F — Delta + Technical (click to expand)
OCS Layout Presence
Delta Configuration Badge
Delta Histogram / CVD
Liquidity Overlay / Cycle
Visible text 'Ocs Ai Trader | Delta Configuration' located below the main price chart.
Visible CVD histogram with red and green columns at the bottom panel; green columns indicate net buying, red columns indicate net selling.
Visible liquidity bands (shades of pink/red and light blue) overlaid on the price chart and a cycle indicator panel.
Liquidity Engine
Active Band
Vs Slow Liquidity
Vs Fast Liquidity
Cycle State
Divergence
Hands-Off Risk
negative liquidity band, with price currently testing/piercing the lower boundary.
below slow negative liquidity line.
below fast negative liquidity line.
fast and slow liquidity lines are diverging downwards.
bearish divergence
medium, due to price being at the extreme edge of the negative liquidity band with high volatility.
Delta Engine
CVD Pressure
Dominant Cycle Leader
Adaptive Filter
Delta Force
Exhaustion Boundary
net selling
negative
bearish ceiling
recent red delta-force arrows visible at the bottom.
negative extreme
Secondary TA
EMA
RSI
MACD
EMA 9: 26,128.13; EMA 21: 26,091.84
RSI 14 close: 29.04 (Oversold)
MACD close 12 26 9: -308.98 / -741.44 / -432.46
Confluence
Setup Type
Directional Bias
Conviction
Confirmation
Contradiction
Key Level
reversal long
bullish
low
RSI is in deep oversold territory and price has hit an extreme negative liquidity boundary.
Price is trending strongly below both fast and slow negative liquidity lines with dominant negative delta cycles.
26,000
* **Current Price:** $26,566.75 (-10.29%)
* **Analysis:** The epicenter of the sell-off. The drop below $27,000 has triggered a cascade of stop-losses.
* **Levels to Watch:** $26,300 (immediate support), $28,000 (resistance/retest).
* **Risk:** Further liquidity withdrawal if the $26,000 level is breached.
ES=F (S&P 500 Futures)
Fig. 3 ES=F — Signals + Liquidity · open full sizeFig. 4 ES=F — Delta + Technical · open full sizeES=F — Unified OCS chart read
Executive Summary
The consensus direction is bearish, with price currently in an active participation state following a confirmed weakness breakdown. Strength is absent as price trades below the 'Weakness Below' trigger (Chart 1) and remains trapped within a negative liquidity band below both fast and slow liquidity lines (Chart 2). The strongest confluence is the alignment between the expanding pink momentum/cycle ribbons (Chart 1) and the net selling CVD pressure paired with downward-trending liquidity lines (Chart 2).
OCS Confluence
Grade
Directional Bias
Participation State
high
bearish
active
Setup Read: The setup is a high-conviction trend-continuation short as price maintains alignment with bearish momentum ribbons, negative liquidity bands, and net selling delta pressure.
Confirmations
Price is trading below the trigger (Chart 1) and below both fast/slow liquidity lines (Chart 2).
Momentum/Cycle regimes are bearish (Chart 1) and CVD pressure is net selling (Chart 2).
Structural context shows price rejecting higher volume zones (Chart 1) and trading within a negative liquidity band (Chart 2).
Contradictions
(none)
Levels To Watch
7375.75 (Trigger - Chart 1)
7746.25 (Catastrophic Stop - Chart 1)
7557 (EMA 21 / Slow Liquidity area - Chart 2)
7300-7500 (Average Float-Volume Zone - Chart 1)
Pink Negative Liquidity Band (Active Zone - Chart 2)
Invalidation
Structural failure occurs upon price crossing above the catastrophic stop at 7746.25 (Chart 1).
Risk Notes
Recent green upward force markers in CVD suggest minor delta exhaustion (Chart 2).
Price is currently trading within a gray average float-volume zone which may offer local support (Chart 1).
ES=F — Signals + Liquidity (click to expand)
Visible Context
Symbol
Timeframe
Layout Confidence
ES1! S&P 500 E-mini Futures
D
high
Signal Engine
Direction
Declaration
Trigger
Trigger Status
Stop / Invalidation
SHORT
Weakness Below
7375.75
Triggered
7746.25
Target Ladder
T1
T2
T3
T4
T5
Booked
Next Unbooked
N/A
N/A
N/A
N/A
N/A
None
N/A
Structure Context
Float-Volume Zones
Momentum Band
Dominant Cycle
Price Location
Structural Context
Price is rejecting a pink extreme float-volume zone (7746.25) and currently trading within a gray average float-volume zone (7300-7500 area).
weakness with price trading within the pink momentum weakness band.
bearish with the pink ribbon expanding downward.
Price is below the trigger of 7375.75 and below the current momentum band, heading toward the lower gray volume zone.
The setup is clean as price has broken below the trigger and is trending within the pink momentum and cycle ribbons.
Setup Read
State
R:R to T1
R:R to Furthest
Invalidation
Evidence Quality
Notes
active
N/A
N/A
Price crossing above the catastrophic stop at 7746.25.
high
Price has triggered the Weakness Below declaration and is currently aligned with pink momentum and cycle regimes.
ES=F — Delta + Technical (click to expand)
OCS Layout Presence
Delta Configuration Badge
Delta Histogram / CVD
Liquidity Overlay / Cycle
Visible at the bottom center of the main price pane: 'Ocs Ai Trader | Delta Configuration'
Visible in the bottom panel; features green and red CVD columns and small green upward force markers.
Visible on the main price pane as shaded liquidity bands (pink/red for negative, green for positive) and stepped liquidity lines.
Liquidity Engine
Active Band
Vs Slow Liquidity
Vs Fast Liquidity
Cycle State
Divergence
Hands-Off Risk
negative, with latest price currently testing/trading within the pink shaded bearish zone
below slow negative liquidity line
below fast negative liquidity line
fast and slow liquidity lines are trending downward in alignment
none
low
Delta Engine
CVD Pressure
Dominant Cycle Leader
Adaptive Filter
Delta Force
Exhaustion Boundary
net selling
negative
bearish ceiling
recent green upward force markers present but CVD columns are predominantly red/negative
none
Secondary TA
EMA
RSI
MACD
EMA 9 at 7,571.69, EMA 21 at 7,557.71
RSI 14 close at 33.43
MACD close 12 26 9 at -38.47
Confluence
Setup Type
Directional Bias
Conviction
Confirmation
Contradiction
Key Level
trend-continuation short
bearish
high
Price is trading below both fast and slow negative liquidity lines within a negative liquidity band, aligned with negative CVD pressure.
None visible
7,557 (EMA 21/Slow Liquidity area)
* **Current Price:** $7,343.50 (-5.24%)
* **Analysis:** Acting as the primary index hedge. The selling here is more orderly than in NQ=F, but the volume is elevated, indicating institutional hedging is active.
* **Levels to Watch:** $7,300 (support), $7,500 (resistance).
BTC (Bitcoin)
Fig. 5 BTC — Signals + Liquidity · open full sizeFig. 6 BTC — Delta + Technical · open full sizeBTC — Unified OCS chart read
Executive Summary
The current BTC outlook is a pre-trigger bullish setup currently undergoing a period of momentum weakness. While Chart 1 — Signals + Liquidity maintains a long declaration with a trigger at 81,104, price is currently trading below this level and within a pink weakness band. Chart 2 — Delta + Technical provides mixed CVD pressure and neutral conviction, suggesting a lack of immediate delta-driven participation to reclaim the structural trigger.
OCS Confluence
Grade
Directional Bias
Participation State
low
bullish
pre-trigger
Setup Read: The setup remains in a pre-trigger state, awaiting a reclaim of 81,104 to confirm the bullish declaration amidst current momentum weakness.
Confirmations
Both charts indicate a lack of immediate upward momentum (Chart 1 weakness band; Chart 2 mixed CVD pressure).
Price is currently positioned between the structural trigger and the invalidation zone (Chart 1).
Contradictions
Chart 1 maintains a high-confidence long declaration while Chart 2 reports low conviction and neutral directional bias.
Levels To Watch
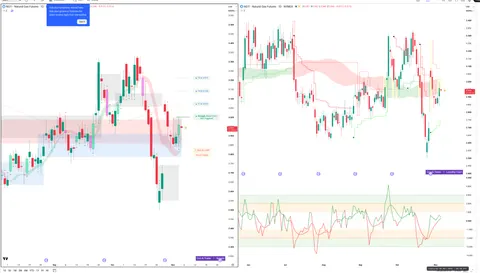
81,104 (Trigger - Chart 1)
83,354 (T1 Target - Chart 1)
79,418 (Stop/Invalidation - Chart 1)
79,228 (21 EMA - Chart 2)
77,788 (9 EMA - Chart 2)
77,000 (Key Level - Chart 2)
Invalidation
A breach below the 79,418 structural stop level (Chart 1).
Risk Notes
Price is currently rejecting a pink extreme float-volume zone (Chart 1).
Absence of delta force and mixed CVD pressure indicates low participation (Chart 2).
Setup is currently conflicting due to price residing within the momentum weakness band (Chart 1).
BTC — Signals + Liquidity (click to expand)
Visible Context
Symbol
Timeframe
Layout Confidence
BTCUSD: Bitcoin / U.S. Dollar
N/A
high
Signal Engine
Direction
Declaration
Trigger
Trigger Status
Stop / Invalidation
LONG
Strength Above
81104
Not Triggered
79418
Target Ladder
T1
T2
T3
T4
T5
Booked
Next Unbooked
83354
85935
88349
N/A
N/A
None
83354
Structure Context
Float-Volume Zones
Momentum Band
Dominant Cycle
Price Location
Structural Context
Latest price is rejecting a pink extreme float-volume zone near 78,000-80,000 and is currently in open space below the blue secondary order block/trigger level.
weakness with price currently residing within the pink weakness band.
transition with the ribbon flattening/stabilizing after a period of positive support.
Price is currently at 75,963, which is below the 81,104 trigger, below all unbooked targets (T1-T3), and above the 79,418 stop level.
The setup is currently conflicting as price is trading below the declared trigger level and within the pink momentum weakness band.
Setup Read
State
R:R to T1
R:R to Furthest
Invalidation
Evidence Quality
Notes
pre-trigger
N/A
N/A
Price breaching the 79,418 stop level.
high
The Strength Above declaration remains unconfirmed as price has not reclaimed the 81,104 trigger level and is currently experiencing weakness within the momentum band.
BTC — Delta + Technical (click to expand)
OCS Layout Presence
Delta Configuration Badge
Delta Histogram / CVD
Liquidity Overlay / Cycle
Visible: 'Ocs Ai Trader | Delta Configuration' badge located above the RSI panel.
Visible green and red vertical histogram/CVD columns at the bottom left, representing net accumulation/distribution.
N/A
Liquidity Engine
Active Band
Vs Slow Liquidity
Vs Fast Liquidity
Cycle State
Divergence
Hands-Off Risk
N/A
N/A
N/A
N/A
N/A
low
Delta Engine
CVD Pressure
Dominant Cycle Leader
Adaptive Filter
Delta Force
Exhaustion Boundary
mixed
N/A
N/A
absent
none
Secondary TA
EMA
RSI
MACD
9 EMA at 77,788; 21 EMA at 79,228
RSI 14 close 68.90
MACD 12 26 9: -298, -1,370, -1,072
Confluence
Setup Type
Directional Bias
Conviction
Confirmation
Contradiction
Key Level
unclear
neutral
low
N/A
OCS liquidity lines and cycles are not visible on the chart to provide engine-side confirmation.
77,000
* **Current Price:** $33.63 (-4.97%)
* **Analysis:** BTC is functioning as the "liquidity of last resort." The correlation between BTC and NQ=F has tightened significantly in the last 48 hours.
* **Risk:** A break below $33.00 could trigger a secondary wave of liquidations in crypto-linked portfolios.
CL=F (WTI Crude)
Fig. 7 CL=F — Signals + Liquidity · open full sizeFig. 8 CL=F — Delta + Technical · open full sizeCL=F — Unified OCS chart read
Executive Summary
The consensus for CL=F is bearish, characterized by a high-conviction trend-continuation setup. The Chart 1 — Signals + Liquidity declaration of 'Weakness Below 95.14' is confirmed by Chart 2 — Delta + Technical, which shows net selling pressure via red CVD columns and price trading below both fast and slow negative liquidity lines. With T1 (90.75) already booked, the structure remains aligned for further downside toward the T2 target.
OCS Confluence
Grade
Directional Bias
Participation State
high
bearish
active
Setup Read: CL=F maintains a high-conviction bearish structure as price trades within negative liquidity bands supported by net selling delta pressure.
Confirmations
Price is trading within a bearish momentum/liquidity band across both layouts.
Negative CVD/Delta force (Chart 2) aligns with the weakness declaration (Chart 1).
Price location below the primary trigger (95.14) confirms active bearish participation.
Successful clearing of T1 (90.75) validates the current structural weakness.
A structural failure would be characterized by price reclaiming the 95.14 trigger level or a significant shift in the dominant cycle from transition/bearish to bullish.
Risk Notes
Price is currently in a red/pink extreme float-volume zone, suggesting a potential for local rejection/mean reversion toward the gray average zone.
Low hands-off risk as the setup maintains tight alignment between delta and liquidity.
CL=F — Signals + Liquidity (click to expand)
Visible Context
Symbol
Timeframe
Layout Confidence
CL1: Light Crude Oil Futures
1D
high
Signal Engine
Direction
Declaration
Trigger
Trigger Status
Stop / Invalidation
SHORT
Weakness Below
95.14
Triggered
N/A
Target Ladder
T1
T2
T3
T4
T5
Booked
Next Unbooked
90.75 (Booked)
86.46
82.13
N/A
N/A
T1 at 90.75
T2 at 86.46
Structure Context
Float-Volume Zones
Momentum Band
Dominant Cycle
Price Location
Structural Context
Price is currently inside a red/pink extreme float-volume zone near 91.20, rejecting lower levels towards the gray average zone.
weakness (price is within the pink weakness band)
transition (flattening pink ribbon at the bottom of the cycle)
Price is below the trigger of 95.14, has cleared booked T1 at 90.75, and is approaching T2 at 86.46.
The setup is clean, with price acting within a weakness band and having successfully cleared the first target.
Setup Read
State
R:R to T1
R:R to Furthest
Invalidation
Evidence Quality
Notes
active
N/A
N/A
N/A
high
The bearish declaration is supported by price trading within the pink momentum weakness band and the successful completion of T1.
CL=F — Delta + Technical (click to expand)
OCS Layout Presence
Delta Configuration Badge
Delta Histogram / CVD
Liquidity Overlay / Cycle
Ocs Ai Trader | Delta Configuration label visible in center of chart.
Visible green and red CVD columns at the bottom panel, with red columns predominating in the recent period.
Visible shaded liquidity bands (green/positive and pink/negative) overlaid on the price candles.
Liquidity Engine
Active Band
Vs Slow Liquidity
Vs Fast Liquidity
Cycle State
Divergence
Hands-Off Risk
negative, with latest price currently sitting within a pink bearish zone.
below slow negative liquidity line.
below fast negative liquidity line.
tangle/bearish alignment
none
low
Delta Engine
CVD Pressure
Dominant Cycle Leader
Adaptive Filter
Delta Force
Exhaustion Boundary
net selling
negative
bearish ceiling
red arrows present at the bottom of the CVD panel.
none
Secondary TA
EMA
RSI
MACD
EMA 9 (red) and EMA 21 (blue) are visible.
RSI 14 is visible at 42.27.
MACD 12 26 9 is visible.
Confluence
Setup Type
Directional Bias
Conviction
Confirmation
Contradiction
Key Level
trend-continuation short
bearish
high
Price is within a negative liquidity band, below both fast and slow negative liquidity lines, supported by red CVD columns and red delta-force arrows.
None visible
90.15 (recent low/pivot area)
* **Current Price:** $91.28 (+21.35%)
* **Analysis:** Geopolitical risk (Iran-US tensions) is dominating. The massive spike in crude is acting as a "stagflationary" headwind, complicating the Fed's potential response to the equity sell-off.
* **Levels to Watch:** $95.00 (resistance), $88.00 (support).
NG=F (Natural Gas)
Fig. 9 NG=F — Signals + Liquidity · open full sizeFig. 10 NG=F — Delta + Technical · open full sizeNG=F — Unified OCS chart read
Executive Summary
The current market regime for NG=F is characterized by a bearish/neutral tension as price navigates a significant zone of resistance. While Chart 1 — Signals + Liquidity identifies a potential LONG declaration pending a move above the 2.839 trigger, Chart 2 — Delta + Technical confirms dominant net selling, negative CVD pressure, and bearish liquidity alignment. Participation remains in a pre-trigger state, as the strength required for a long bias is currently suppressed by a pink weakness momentum regime and bearish delta force.
OCS Confluence
Grade
Directional Bias
Participation State
medium
bearish
pre-trigger
Setup Read: NG=F is currently in a pre-trigger state, exhibiting bearish delta pressure and liquidity alignment while awaiting a decisive move above 2.839 to confirm bullish participation.
Confirmations
Both charts indicate price is currently navigating a zone of weakness/selling pressure.
Price remains below the primary bullish participation trigger (2.839) and the EMA 21 (2.956).
Momentum and Delta force both currently align with a negative/bearish regime.
Contradictions
Chart 1 identifies a high-confidence Long declaration pending a trigger, whereas Chart 2 views the immediate trend-continuation through a bearish lens.
Levels To Watch
2.839 (Strength Trigger - Chart 1)
2.956 (EMA 21 Resistance - Chart 2)
3.066 (Next Unbooked Target - Chart 1)
2.639 (Catastrophic Stop - Chart 1)
2.700-3.000 (Pink Weakness Band - Chart 1)
2.839-3.000 (Red Extreme Float-Volume Zone - Chart 1)
Invalidation
Structural failure occurs if price closes below the catastrophic stop at 2.639 (Chart 1).
Risk Notes
Hands-off risk due to mixed cycle alignment and price testing lower liquidity boundaries (Chart 2).
Price is currently constrained by a pink weakness momentum regime (Chart 1).
Potential for chop as RSI shows slight flattening (Chart 2).
NG=F — Signals + Liquidity (click to expand)
Visible Context
Symbol
Timeframe
Layout Confidence
NG1! Natural Gas Futures - 1D
1D
high
Signal Engine
Direction
Declaration
Trigger
Trigger Status
Stop / Invalidation
LONG
Strength Above
2.839
Not Triggered
2.639
Target Ladder
T1
T2
T3
T4
T5
Booked
Next Unbooked
3.066
3.133
3.202
N/A
N/A
None
3.066
Structure Context
Float-Volume Zones
Momentum Band
Dominant Cycle
Price Location
Structural Context
Price is currently rejecting a red extreme float-volume zone at 2.839-3.000 and remains within a blue above-average volume zone near 2.700.
weakness with price currently navigating the pink weakness band between 2.700 and 3.000.
stabilizing with the ribbon flattening in the recent price action near the 2.900 level.
Price is currently below the trigger of 2.839, situated between the blue zone at 2.700 and the red zone at 2.839.
The setup is currently in a pre-trigger state as price remains below the declared strength trigger within a pink weakness regime.
Setup Read
State
R:R to T1
R:R to Furthest
Invalidation
Evidence Quality
Notes
pre-trigger
risk_reward_to_furthest: N/A
N/A
Price closing below the catastrophic stop at 2.639.
high
The strength declaration requires a move above 2.839 to confirm participation, currently constrained by a pink weakness momentum regime.
NG=F — Delta + Technical (click to expand)
OCS Layout Presence
Delta Configuration Badge
Delta Histogram / CVD
Liquidity Overlay / Cycle
Ocs Ai Trader | Delta Configuration badge is visible on the left side of the middle panel.
Visible CVD columns (green and red) in the bottom panel, accompanied by small green and red delta-force arrows at the top of the bottom panel.
Visible liquidity bands (green/red shaded areas) overlaid on the price chart and a cycle/liquidity line panel in the middle section.
Liquidity Engine
Active Band
Vs Slow Liquidity
Vs Fast Liquidity
Cycle State
Divergence
Hands-Off Risk
negative, with latest price within a red shaded bearish zone.
below slow negative liquidity line.
below fast negative liquidity line.
fast and slow cycles are in a negative alignment/tangle near the recent price move.
bearish divergence
medium, due to price testing the lower boundaries of the negative liquidity band with mixed cycle alignment.
Delta Engine
CVD Pressure
Dominant Cycle Leader
Adaptive Filter
Delta Force
Exhaustion Boundary
net selling
negative
bearish ceiling
recent red arrows visible.
none
Secondary TA
EMA
RSI
MACD
EMA 21 close: 2.956
RSI 14 close: 41.51
MACD 12 26 9: 0.007 -0.026 -0.033
Confluence
Setup Type
Directional Bias
Conviction
Confirmation
Contradiction
Key Level
trend-continuation short
bearish
medium
Price is trending within a negative liquidity band supported by red CVD columns and negative delta-force markers.
Price is approaching the EMA 21 and showing a slight flattening in the RSI.
2.956 (EMA 21)
* **Current Price:** $2.95 (+9.71%)
* **Analysis:** Moving in sympathy with the broader energy complex. The volatility here is high, but it remains secondary to the crude-driven geopolitical narrative.
Historical Parallels
The current market structure bears a striking resemblance to the "Flash Crash" environments of 2010 and the liquidity-driven volatility of March 2020. In both cases, the trigger was a rapid, retail-driven capitulation that forced market makers to widen spreads, creating a vacuum that only stabilized once institutional buyers stepped in to provide liquidity at deeply discounted levels. The key difference today is the "Crypto-Equity Feedback Loop"—a mechanism that did not exist in 2010 and was in its infancy in 2020. This adds a layer of 24/7 volatility that makes the current deleveraging process more efficient, and potentially more violent.
Outlook & Risk Matrix
Short-Term (1-5 Days): High Volatility / Liquidity Stress
The market is in a "survival mode." Expect continued high volatility in NQ=F and ES=F. The VXX/UVXY complex will likely remain elevated until there is a clear signal of institutional intervention or a stabilization in the geopolitical rhetoric regarding Iran.
Medium-Term (1-4 Weeks): Stabilization vs. Re-rating
The medium-term outlook depends on whether the "Liquidity Black Hole" leads to a systemic failure or if it acts as a "clearing event" that resets valuations. If the Fed maintains its "higher for longer" stance despite the equity sell-off, the risk of a deeper, more structural correction increases. If, however, the sell-off forces a shift in forward guidance, we may see a stabilization.
Scenarios:
Bullish (Base Case): Liquidity returns as retail capitulation completes; market finds support at technical levels; volatility compresses.
Bearish: The "Liquidity Black Hole" widens; margin calls trigger a broader financial contagion (e.g., banking sector stress); VIX remains elevated above 30.
What to Watch
NQ=F Order Book Depth: Watch for signs of "gap-filling" or stabilization in order book depth. If spreads remain wide, the liquidity vacuum persists.
BTC Correlation: If BTC decouples from NQ=F, it may signal that the "liquidity buffer" selling has exhausted itself.
USDINR and FII Flows: A stabilization in the Rupee and a halt in FII selling of Indian IT ADRs would be a strong signal that global margin pressure is easing.
Energy/Geopolitical Rhetoric: Any de-escalation in Iran-related rhetoric will be immediately reflected in CL=F and will likely provide the relief rally catalyst for equities.
Education and market research only, not financial advice. Charts are OCS AI Trader readings at the time of writing and change with new bars.