The Liquidity Feedback Loop: Nasdaq Plunge Triggers JPY Carry Unwind
Executive summary
The financial landscape on November 6, 2026, is defined by a violent deleveraging event. A 6.36% plunge in the Nasdaq 100 has acted as a systemic catalyst, forcing institutional investors to liquidate high-beta growth positions to satisfy margin calls. This has triggered a "Volatility-Carry Paradox," where the resulting spike in market volatility is forcing the rapid, forced unwinding of JPY-funded carry trades. As capital repatriates to Japan, the USDJPY pair is testing critical psychological support at 150, creating a recursive feedback loop that is draining global liquidity and forcing a defensive rotation into gold and emerging market value plays.
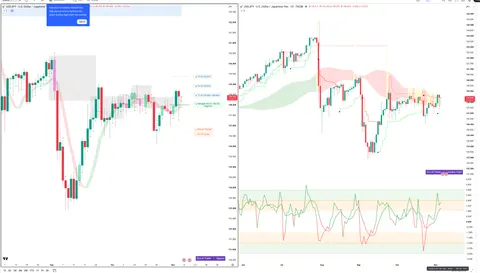
The USD/JPY structure is currently in a state of exhaustion following a successful bullish expansion. While the Chart 1 — Signals + Liquidity engine confirms the completion of two targets (T1, T2) and identifies price rejecting an extreme float-volume zone, the Chart 2 — Delta + Technical engine shows a shift toward bearish force, with price trading within a negative liquidity band and exhibiting mixed-to-negative CVD pressure. The primary tension lies between the remaining upside target (T3) and the immediate bearish delta/liquidity confluence.
OCS Confluence
Grade
Directional Bias
Participation State
medium
neutral
exhausted
Setup Read: USD/JPY is exhibiting price exhaustion at a confluence of extreme float-volume and negative liquidity zones following the completion of initial bullish targets.
Confirmations
Both charts identify significant resistance at current price levels (Pink Float-Volume Zone in Chart 1; Negative Liquidity Band in Chart 2).
Price action shows signs of momentum deceleration (Transitioning ribbon in Chart 1; Negative Delta Cycle in Chart 2).
Contradictions
Chart 1 maintains a structural Long bias toward T3, whereas Chart 2 identifies a trend-continuation short bias based on delta and liquidity flow.
Levels To Watch
159.872 (T3 Target - Chart 1)
158.055 (Long Trigger - Chart 1)
157.863 (EMA 21 / Pivot - Chart 2)
Pink Extreme Float-Volume Zone (Resistance - Chart 1)
Red/Pink Negative Liquidity Band (Resistance - Chart 2)
Invalidation
Structural failure of the bullish setup occurs if price fails to respect the 158.055 trigger level or if momentum transitions into a confirmed negative cycle.
Risk Notes
Exhaustion risk due to price having already achieved two targets (Chart 1).
Medium hands-off risk due to price testing boundaries of negative liquidity (Chart 2).
Potential for chop as the dominant cycle flattens and transitions (Chart 1).
USDJPY — Signals + Liquidity (click to expand)
Visible Context
Symbol
Timeframe
Layout Confidence
USD/JPY
1D
high
Signal Engine
Direction
Declaration
Trigger
Trigger Status
Stop / Invalidation
LONG
Strength Above
158.055
Triggered
N/A
Target Ladder
T1
T2
T3
T4
T5
Booked
Next Unbooked
158.465 (Booked)
158.916 (Booked)
159.872
N/A
N/A
T1, T2
T3
Structure Context
Float-Volume Zones
Momentum Band
Dominant Cycle
Price Location
Structural Context
Price is currently rejecting the pink extreme float-volume zone at the top of the recent range.
weakness; price is currently within the pink weakness band.
transition; the ribbon is flattening and transitioning from a positive cycle toward a neutral/stabilizing state.
Price is above the trigger (158.055) and the booked targets (T1/T2), but is currently testing resistance within the pink momentum band and the extreme float-volume zone.
The setup is crowded as price has already achieved two targets and is currently encountering confluence between the pink momentum band and the pink extreme float-volume zone.
Setup Read
State
R:R to T1
R:R to Furthest
Invalidation
Evidence Quality
Notes
exhausted
N/A
N/A
N/A
high
The upward expansion has completed two targets, and current price action shows rejection at the intersection of the pink momentum band and the extreme float-volume zone.
USDJPY — Delta + Technical (click to expand)
OCS Layout Presence
Delta Configuration Badge
Delta Histogram / CVD
Liquidity Overlay / Cycle
Ocs Ai Trader | Delta Configuration badge is visible in the middle-left area of the chart.
Visible CVD histogram at the bottom with green and red bars, alongside delta-force arrows (green and red triangles) at the very bottom.
Visible liquidity bands (pinkish/reddish shaded zones) and stepped liquidity lines overlaid on the price action.
Liquidity Engine
Active Band
Vs Slow Liquidity
Vs Fast Liquidity
Cycle State
Divergence
Hands-Off Risk
negative, with latest price currently sitting within a red/pink negative liquidity band.
below slow negative liquidity line.
below fast negative liquidity line.
tangle/convergence near recent price action.
none
medium, due to price testing the boundaries of the negative liquidity band and potential for a bounce or further distribution.
Delta Engine
CVD Pressure
Dominant Cycle Leader
Adaptive Filter
Delta Force
Exhaustion Boundary
mixed, showing recent red columns (selling) following previous green accumulation.
negative
bearish ceiling
mixed, recent red arrows at the bottom.
none
Secondary TA
EMA
RSI
MACD
EMA 21 close 157.863
RSI 14 close 47.22
MACD close 12 26 9 -0.015 0.052 0.067
Confluence
Setup Type
Directional Bias
Conviction
Confirmation
Contradiction
Key Level
trend-continuation short
bearish
medium
Price is trading within a negative liquidity band and below both fast and slow liquidity lines with a negative dominant delta cycle.
Recent CVD shows some green accumulation bars prior to the latest red decline.
157.86 (EMA 21 / recent pivot)
The Cascading Impact Chain
Layer 1: Direct Impacts (The Catalyst)
The primary driver is the abrupt AI-led selloff, manifested in the Nasdaq 100’s worst single-day performance since 2020. This is not merely a valuation correction; it is a liquidity-driven event.
Assets: NQ, QQQ, NVDA, TSM, AAPL.
Mechanism: Risk-off sentiment and margin call-induced selling. The "Magnificent 7" complex is experiencing a forced liquidation, creating a liquidity vacuum that is dragging broader indices (ES, RTY) lower.
Fig. 3 QQQ — Signals + Liquidity · open full sizeFig. 4 QQQ — Delta + Technical · open full sizeQQQ — Unified OCS chart read
Executive Summary
The consensus direction for QQQ is bearish, characterized by an active trend-continuation setup. Both analyses confirm high-conviction weakness, with Chart 1 — Signals + Liquidity noting price is exiting a blue secondary order block into open space within a pink weakness band, while Chart 2 — Delta + Technical validates this via net selling CVD pressure and price trading below both fast and slow negative liquidity lines.
OCS Confluence
Grade
Directional Bias
Participation State
high
bearish
active
Setup Read: The setup exhibits high-confluence bearish momentum as price declines through liquidity zones supported by negative delta and a bearish dominant cycle.
Confirmations
Bearish momentum alignment: Pink weakness band [Chart 1] matches negative delta force and red CVD columns [Chart 2].
Structural breakdown: Price is below the trigger of 683.17 [Chart 1] and below both fast and slow liquidity lines [Chart 2].
Cycle synchronization: Bearish dominant cycle [Chart 1] aligns with the negative liquidity cycle state [Chart 2].
Structural failure occurs upon a breach of the catastrophic stop at 699.43.
Risk Notes
Medium hands-off risk due to rapid descent through multiple liquidity levels [Chart 2].
Potential for bearish divergence as price makes lower lows while liquidity attempts to stabilize [Chart 2].
QQQ — Signals + Liquidity (click to expand)
Visible Context
Symbol
Timeframe
Layout Confidence
QQQ: Invesco QQQ Trust, Series 1
1D
high
Signal Engine
Direction
Declaration
Trigger
Trigger Status
Stop / Invalidation
SHORT
Weakness Below
683.17
Triggered
699.43
Target Ladder
T1
T2
T3
T4
T5
Booked
Next Unbooked
675.92 (Booked)
668.87 (Booked)
661.72 (Booked)
645.27 (Booked)
637.17
T1, T2, T3, T4
T5 637.17
Structure Context
Float-Volume Zones
Momentum Band
Dominant Cycle
Price Location
Structural Context
Latest price is breaking/exiting the blue secondary order block zone into open space.
weakness; price is trading within the pink weakness band.
bearish; the pink ribbon is sloping downward and active.
Current price (647.05) is below the trigger (683.17), above the next target (637.17), and below the stop (699.43).
The setup shows high confluence as price is declining within the pink momentum band, aligned with a bearish dominant cycle and recent break from the blue volume zone.
Setup Read
State
R:R to T1
R:R to Furthest
Invalidation
Evidence Quality
Notes
active
N/A
0.23
Price breach of the catastrophic stop at 699.43.
high
The structure exhibits momentum alignment with the pink weakness band and a bearish dominant cycle following a break from the secondary order block.
QQQ — Delta + Technical (click to expand)
OCS Layout Presence
Delta Configuration Badge
Delta Histogram / CVD
Liquidity Overlay / Cycle
Ocs Ai Trader | Delta Configuration visible above the bottom panel.
Visible green and red delta/CVD columns at the bottom, with small green and red triangle delta-force markers above/below the bars.
Visible liquidity bands (pink/green) and stepped liquidity lines overlaid on the price action.
Liquidity Engine
Active Band
Vs Slow Liquidity
Vs Fast Liquidity
Cycle State
Divergence
Hands-Off Risk
negative, with price currently within a pink bearish zone.
below slow negative liquidity line.
below fast negative liquidity line.
fast and slow liquidity lines are both trending downward with price below them.
bearish divergence (price making lower lows while liquidity cycle attempts to stabilize).
medium due to the rapid descent through multiple liquidity levels.
Delta Engine
CVD Pressure
Dominant Cycle Leader
Adaptive Filter
Delta Force
Exhaustion Boundary
net selling
negative
bearish ceiling
recent red delta-force arrows are visible.
none
Secondary TA
EMA
RSI
MACD
EMA 8 close: 659.78, EMA 21 close: 706.81
RSI 14 close: 36.86
MACD close: -6.22, MACD signal: -14.55
Confluence
Setup Type
Directional Bias
Conviction
Confirmation
Contradiction
Key Level
trend-continuation short
bearish
high
Price is trading within a negative liquidity band, below both fast and slow liquidity lines, supported by red CVD columns and negative delta force markers.
None visible.
650.00 (immediate psychological/price support/resistance level near current price).
Fig. 5 NQ — Signals + Liquidity · open full sizeFig. 6 NQ — Delta + Technical · open full sizeNQ — Unified OCS chart read
Executive Summary
The consensus direction for NQ is bearish, characterized by a high-conviction trend-continuation setup. While Chart 1 — Signals + Liquidity confirms the price is currently traversing open space toward T3 (24177.25) following the successful breach of the 28333.50 trigger, Chart 2 — Delta + Technical validates this movement through aggressive net selling, red delta-force markers, and price positioning within a negative liquidity band at 26,400.25.
OCS Confluence
Grade
Directional Bias
Participation State
high
bearish
active
Setup Read: NQ maintains a high-conviction bearish trend-continuation profile, supported by sequential target achievement and aggressive delta-driven selling pressure.
Confirmations
Sequential target completion (T1, T2) aligns with persistent negative CVD pressure and net selling (Chart 1 & Chart 2).
Price remains below key momentum/cycle thresholds, including the pink net-bearish regime (Chart 1) and the bearish ceiling (Chart 2).
Structural weakness is corroborated by both the negative cycle pressure ribbon (Chart 1) and the downward-sloping parallel liquidity lines (Chart 2).
Invalidation would occur upon a structural shift to a green momentum/cycle regime or a breach of the catastrophic stop (not explicitly labeled).
Risk Notes
Medium hands-off risk due to price operating within a negative liquidity band with aggressive red CVD columns (Chart 2).
Potential for exhaustion as price moves through open space toward T3 (Chart 1).
NQ — Signals + Liquidity (click to expand)
Visible Context
Symbol
Timeframe
Layout Confidence
NQ1! NASDAQ 100 E-Mini Futures
D
high
Signal Engine
Direction
Declaration
Trigger
Trigger Status
Stop / Invalidation
SHORT
Weakness Below
28333.50
Triggered
N/A
Target Ladder
T1
T2
T3
T4
T5
Booked
Next Unbooked
27926.50 (Booked)
26858.50 (Booked)
24177.25
N/A
N/A
T1, T2
T3
Structure Context
Float-Volume Zones
Momentum Band
Dominant Cycle
Price Location
Structural Context
Price is currently rejecting the gray average float-volume/order-block zone near 27,500 and moving through open space toward T3.
weakness with price operating within the pink net-bearish composite regime band.
bearish with the pink negative cycle pressure ribbon trending downward.
Price is below the trigger (28333.50) and the booked targets, currently positioned between T2 and T3.
The setup shows high confluence with price respecting the pink momentum band and negative cycle ribbon while progressing through subsequent targets.
Setup Read
State
R:R to T1
R:R to Furthest
Invalidation
Evidence Quality
Notes
active
N/A
N/A
Invalidation would occur upon a breach of the catastrophic stop (not labeled) or structural shift to a green momentum/cycle regime.
high
The structure demonstrates sequential target completion within a prevailing bearish momentum and cycle regime.
NQ — Delta + Technical (click to expand)
OCS Layout Presence
Delta Configuration Badge
Delta Histogram / CVD
Liquidity Overlay / Cycle
Visible in the center of the chart as 'Ocs Ai Trader | Delta Configuration'.
Visible in the bottom panel as large red and green columns representing CVD, with small green/red triangles above/below the zero line acting as delta force markers.
Visible on the main price chart as shaded green and red liquidity bands and stepped liquidity lines.
Liquidity Engine
Active Band
Vs Slow Liquidity
Vs Fast Liquidity
Cycle State
Divergence
Hands-Off Risk
negative, with the latest price currently at 26,400.25 situated within a red shaded zone.
below slow negative liquidity line
below fast negative liquidity line
fast and slow liquidity lines are in a downward-sloping parallel state following recent price drops.
none
medium, due to price being in a negative liquidity band with recent aggressive red CVD columns.
Delta Engine
CVD Pressure
Dominant Cycle Leader
Adaptive Filter
Delta Force
Exhaustion Boundary
net selling
negative
bearish ceiling
recent red delta-force arrows visible in the bottom panel.
none
Secondary TA
EMA
RSI
MACD
EMA 9: 28,150.63; EMA 21: 28,036.06
RSI 14 close: 39.55 (below 50)
MACD close 12 26 9: -301.80 (below zero)
Confluence
Setup Type
Directional Bias
Conviction
Confirmation
Contradiction
Key Level
trend-continuation short
bearish
high
Price is trading within a negative liquidity band supported by negative delta-force markers and large red CVD columns.
None visible
26,400.25
Layer 2: Secondary Effects (The Carry Trade Unwind)
The volatility in tech stocks is bleeding into the FX markets. As institutional portfolios face margin pressure, the most liquid available funding source—the JPY carry trade—is being unwound.
Assets: USDJPY, FXY, GBPJPY, EURJPY.
Mechanism: Repatriation of capital into the Yen. As carry traders deleverage, they buy back JPY to close out short positions, accelerating the USDJPY breakdown. This is a classic "liquidity-first" reaction.
The contagion is shifting from equity volatility to currency stress and commodity decoupling.
Assets: BTC, ETH, SOL, NIFTY, GLD.
Mechanism: Crypto assets, trading 24/7, are serving as the "liquidity of last resort." Investors are liquidating digital assets to cover equity margin calls, creating a correlation spike. Simultaneously, we are seeing an "India Defensive" anomaly, where FIIs rotate capital from US tech into Indian large-caps (NIFTY/RELIANCE) as a proxy for value, decoupling from the broader NQ weakness.
Fig. 7 ETH — Signals + Liquidity · open full sizeFig. 8 ETH — Delta + Technical · open full sizeETH — Unified OCS chart read
Executive Summary
The consensus direction is bearish, characterized by a trend-continuation setup with high structural alignment. Chart 1 — Signals + Liquidity identifies a clean short setup via price rejection of an extreme float-volume zone, while Chart 2 — Delta + Technical confirms this through net selling CVD pressure and price trading below both fast and slow negative liquidity lines. Current participation is in a pre-trigger state as price seeks the first liquidity target.
OCS Confluence
Grade
Directional Bias
Participation State
high
bearish
pre-trigger
Setup Read: The ETHUSD 1D structure presents a bearish trend-continuation setup supported by negative delta flow and extreme volume zone rejections.
Confirmations
Alignment of negative momentum bands and bearish cycle ribbons [Chart 1]
Confluence of net selling CVD and recent red delta-force markers [Chart 2]
Price position below both fast and slow negative liquidity lines [Chart 2]
Structural rejection of extreme float-volume zones [Chart 1]
Structural failure occurs upon a reclaim of the 2348.37 trigger level or a shift out of the negative momentum band.
Risk Notes
Medium hands-off risk due to price oscillating near the transition of the negative liquidity band [Chart 2]
Potential for exhaustion as price approaches the T1 target [Chart 1]
ETH — Signals + Liquidity (click to expand)
Visible Context
Symbol
Timeframe
Layout Confidence
ETHUSD- Ethereum / U.S. Dollar
1D
high
Signal Engine
Direction
Declaration
Trigger
Trigger Status
Stop / Invalidation
SHORT
Weakness Below
2348.37
Not Triggered
N/A
Target Ladder
T1
T2
T3
T4
T5
Booked
Next Unbooked
2233.00
N/A
N/A
N/A
N/A
None
2233.00
Structure Context
Float-Volume Zones
Momentum Band
Dominant Cycle
Price Location
Structural Context
Price is currently rejecting a red/pink extreme float-volume zone near 2348.
weakness with price trading within the pink weakness band.
bearish with a steep pink ribbon indicating negative cycle pressure.
Price is below the trigger of 2348.37 and approaching the T1 target of 2233.00.
The setup is clean as price is within a weakness momentum band and reacting to an extreme float-volume zone.
Setup Read
State
R:R to T1
R:R to Furthest
Invalidation
Evidence Quality
Notes
pre-trigger
N/A
N/A
N/A
high
The structure shows a confluence of a pink momentum band, a steep negative cycle ribbon, and price positioning within an extreme float-volume zone.
ETH — Delta + Technical (click to expand)
OCS Layout Presence
Delta Configuration Badge
Delta Histogram / CVD
Liquidity Overlay / Cycle
Ocs Ai Trader | Delta Configuration badge is visible above the CVD panel.
Green and red CVD columns are visible, with recent red columns indicating net selling accumulation. Green delta-force arrows are visible in the earlier period, and red delta-force arrows are visible in the recent period.
Visible liquidity bands (green/positive and red/negative) and stepped liquidity lines are overlaid on the price chart.
Liquidity Engine
Active Band
Vs Slow Liquidity
Vs Fast Liquidity
Cycle State
Divergence
Hands-Off Risk
negative liquidity band, with recent price action oscillating within/near the red zone.
below slow negative liquidity line.
below fast negative liquidity line.
tangle/bearish alignment.
none
medium due to price oscillating near the transition of the negative band and recent CVD pressure.
Delta Engine
CVD Pressure
Dominant Cycle Leader
Adaptive Filter
Delta Force
Exhaustion Boundary
net selling
negative
bearish ceiling
recent red arrows
none
Secondary TA
EMA
RSI
MACD
EMA 9 close: 2,267.17; EMA 21 close: 2,321.96
RSI 14 close: 40.02
MACD close 12 26 9: -58.61
Confluence
Setup Type
Directional Bias
Conviction
Confirmation
Contradiction
Key Level
trend-continuation short
bearish
medium
Price is below both fast and slow liquidity lines within a negative liquidity band, supported by recent red CVD columns and red delta-force markers.
None visible.
2,321.96 (EMA 21/liquidity resistance area)
Fig. 9 BTC — Signals + Liquidity · open full sizeFig. 10 BTC — Delta + Technical · open full sizeBTC — Unified OCS chart read
Executive Summary
The consensus outlook is bearish-leaning neutral as price remains in a pre-trigger state for bullish expansion. While Chart 1 — Signals + Liquidity identifies a long declaration above 81104, Chart 2 — Delta + Technical confirms active downward momentum through net selling CVD pressure and price trading below key EMAs. The strongest evidence is the disconnect between the unconfirmed bullish signal and the high-conviction bearish delta/liquidity alignment.
OCS Confluence
Grade
Directional Bias
Participation State
low
bearish
pre-trigger
Setup Read: BTC is currently navigating a pre-trigger phase where bullish structural declarations remain unconfirmed by price action and delta accumulation.
Confirmations
Price is currently positioned below the bullish strength trigger of 81104 (Chart 1) and below the negative liquidity band (Chart 2).
Momentum is transitioning toward weakness as evidenced by the pink momentum band (Chart 1) and net selling CVD pressure (Chart 2).
Contradictions
Chart 1 declares a LONG direction (pending trigger), whereas Chart 2 identifies a trend-continuation SHORT bias.
A close below the 79418 catastrophic stop level invalidates the bullish structural setup.
Risk Notes
Medium hands-off risk due to price exiting the liquidity band into a potential price vacuum (Chart 2).
Conflicting structural context as price rejects a volume zone while failing to reach the trigger level (Chart 1).
BTC — Signals + Liquidity (click to expand)
Visible Context
Symbol
Timeframe
Layout Confidence
BTCUSD
1D
high
Signal Engine
Direction
Declaration
Trigger
Trigger Status
Stop / Invalidation
LONG
Strength Above
81104
Not Triggered
79418
Target Ladder
T1
T2
T3
T4
T5
Booked
Next Unbooked
83054
85935
88349
N/A
N/A
None
83054
Structure Context
Float-Volume Zones
Momentum Band
Dominant Cycle
Price Location
Structural Context
Price is currently rejecting a red/pink extreme float-volume zone near 78,000-80,000.
mixed; price is exiting a green strength band and moving into a pink weakness band area.
transition; the ribbon is flattening and transitioning from green to pink/neutral.
Price is below the 81104 trigger, below T1 (83054), and above the 79418 stop.
The setup is conflicting as price is below the Strength Above trigger while simultaneously rejecting an extreme float-volume zone.
Setup Read
State
R:R to T1
R:R to Furthest
Invalidation
Evidence Quality
Notes
pre-trigger
N/A
N/A
A close below the 79418 catastrophic stop level.
high
The strength declaration remains unconfirmed as price has not surpassed the 81104 trigger level.
BTC — Delta + Technical (click to expand)
OCS Layout Presence
Delta Configuration Badge
Delta Histogram / CVD
Liquidity Overlay / Cycle
Ocs Ai Trader | Delta Configuration badge is visible above the main chart panel.
Green and red vertical CVD columns are visible in the bottom panel, showing net buying and selling accumulation respectively.
A pink/purple liquidity band is visible behind the price action in the main chart panel.
Liquidity Engine
Active Band
Vs Slow Liquidity
Vs Fast Liquidity
Cycle State
Divergence
Hands-Off Risk
negative liquidity band, with price currently trending downwards through the band toward the bottom of the visible range.
below slow negative liquidity line
below fast negative liquidity line
tangle/alignment unclear due to lack of explicit cycle lines, but price is below the liquidity band.
none
medium due to price exiting the liquidity band and falling into price vacuum/uncertainty.
Delta Engine
CVD Pressure
Dominant Cycle Leader
Adaptive Filter
Delta Force
Exhaustion Boundary
net selling
negative
bearish ceiling
absent
none
Secondary TA
EMA
RSI
MACD
EMA 9 close: 77,787; EMA 21 close: 79,238
RSI 14 close: 36.89
MACD 12 26 9: -298, -1,370, -1,072
Confluence
Setup Type
Directional Bias
Conviction
Confirmation
Contradiction
Key Level
trend-continuation short
bearish
medium
Price is trading below both the negative liquidity band and both visible EMAs, while CVD shows net selling accumulation.
None visible
79,238 (EMA 21)
Layer 4: Non-Obvious Connections (The Feedback Loop)
The most critical risk is the "Volatility-Carry Paradox." The recursive loop works as follows: NQ volatility forces margin calls → margin calls force JPY carry trade liquidation (USDJPY drops) → USDJPY drop signals broader financial stress → risk-off sentiment intensifies → NQ falls further. This is a self-reinforcing liquidity trap. Furthermore, the decoupling of Gold (GLD) from Treasuries (TLT) highlights that investors are exiting long-duration bonds to raise cash while simultaneously buying gold as a pure currency hedge against the JPY/USD volatility.
Unified OCS Chart Read
Setup Read: The market is currently in a "Hands-Off/Volatility Expansion" phase. The RSI(14) on QQQ at 26.75 signals an oversold condition, yet the MACD divergence (-14.71) suggests the momentum remains firmly bearish. For USDJPY, the failure to hold above the 150 handle is the primary technical signal; the lack of a bounce indicates that the "carry trade" is not just pausing, but actively unwinding.
Levels to Watch:
QQQ: $647.05 is the immediate pivot. A breach of this level confirms the next leg down.
USDJPY: 150.00 is the critical psychological and structural support. A daily close below this level confirms a trend reversal for the carry trade.
BTC: $33.63 is showing signs of liquidity exhaustion. Watch for a bounce if equity markets stabilize, but expect further downside if the NQ gap-down continues.
Confirmation/Contradiction: The price action confirms a liquidity-driven selloff rather than a fundamental repricing. The divergence between NIFTY (defensive rotation) and NQ (liquidity liquidation) confirms that capital is not leaving the market entirely, but rather moving from high-beta tech to defensive/value proxies.
Security-by-Security Analysis
Forex Majors & Crosses
USDJPY: The epicenter of the current volatility. With the carry trade unwinding, the pair is under intense downward pressure. The 150 level is the line in the sand. Risk Note: If USDJPY breaks 150 decisively, expect further acceleration as stop-losses for carry traders are triggered.
EURUSD & GBPUSD: Both are caught in the DXY crossfire. As the Fed narrative remains "Higher for Longer" (October Services PMI 54.5), the dollar is finding a bid against the Euro and Pound, even as the Yen strengthens. This creates a bifurcated FX market: a strong USD against Europeans, but a weakening USD against the JPY.
USDCHF: Acting as a secondary safe haven, but the move is muted compared to the JPY.
AUDUSD: Highly sensitive to the risk-off sentiment. The commodity-linked currency is suffering as global growth expectations are re-rated lower due to the tech liquidity squeeze.
Equities & Tech
QQQ: The primary casualty. The 6.49% drop to $647.05 reflects the scale of the margin calls.
NVDA: Facing a double-whammy: the general tech selloff and the "Semiconductor CAPEX-to-Credit Spread" trap. As credit spreads widen, the cost of capital for AI infrastructure investment rises, forcing a re-rating of growth expectations.
Crypto (The Liquidity Proxy)
BTC & ETH: BTC ($33.63) and ETH ($21.40) are experiencing a "Liquidity Fungibility Trap." Because crypto markets remain open while traditional exchanges close, they are absorbing the margin call pressure of the weekend/off-hours. The 7.28% drop in ETH is particularly telling; it is being used as a cash-raising vehicle for institutional portfolios.
Historical Parallels
The current environment bears a striking resemblance to the mid-2024 deleveraging event. In both instances, tech-heavy indices (Nasdaq 100) led the downside, and the JPY served as the primary funding currency for the unwind. The key difference today is the "Crypto-Equity Liquidity Fungibility Trap," which was less pronounced in 2024. The presence of crypto as a 24/7 liquidity valve makes the current market response faster and more volatile than previous cycles.
Outlook & Risk Matrix
Short-Term (1-5 Days)
Expectation: High volatility and continued liquidity-driven selling. The "Volatility-Carry Paradox" remains in effect.
Key Risk: A "Monday Gap Down." If crypto markets continue to bleed over the weekend, Monday's equity open will likely see a significant gap lower as the liquidity drain is priced into the opening print.
Bull Case: A rapid intervention or a stabilization in USDJPY above 150 would signal that the carry trade unwind has been contained.
Medium-Term (1-4 Weeks)
Expectation: A period of stabilization and sector rotation. Investors will likely continue to shift from high-multiple AI tech into defensive sectors (XLP, XLU) and value-oriented EM indices (NIFTY).
Key Risk: The Fed's reaction function. If the liquidity squeeze causes systemic banking stress, the Fed may be forced to pivot, which would invert the current DXY strength and potentially ignite a relief rally.
What to Watch
USDJPY 150 Level: The definitive indicator of whether this is a controlled unwind or a systemic rout.
Crypto Weekend Price Action: BTC and ETH will continue to act as the "canary in the coal mine" for Monday's equity open.
FII Flows into India: Monitor NIFTY/RELIANCE performance. If this defensive rotation holds, it confirms the "proxy value" thesis.
Credit Spreads: A widening in corporate credit spreads (HYG/JNK) would signal that the liquidity issue is moving from the stock market to the broader economy.
Education and market research only, not financial advice. Charts are OCS AI Trader readings at the time of writing and change with new bars.