-
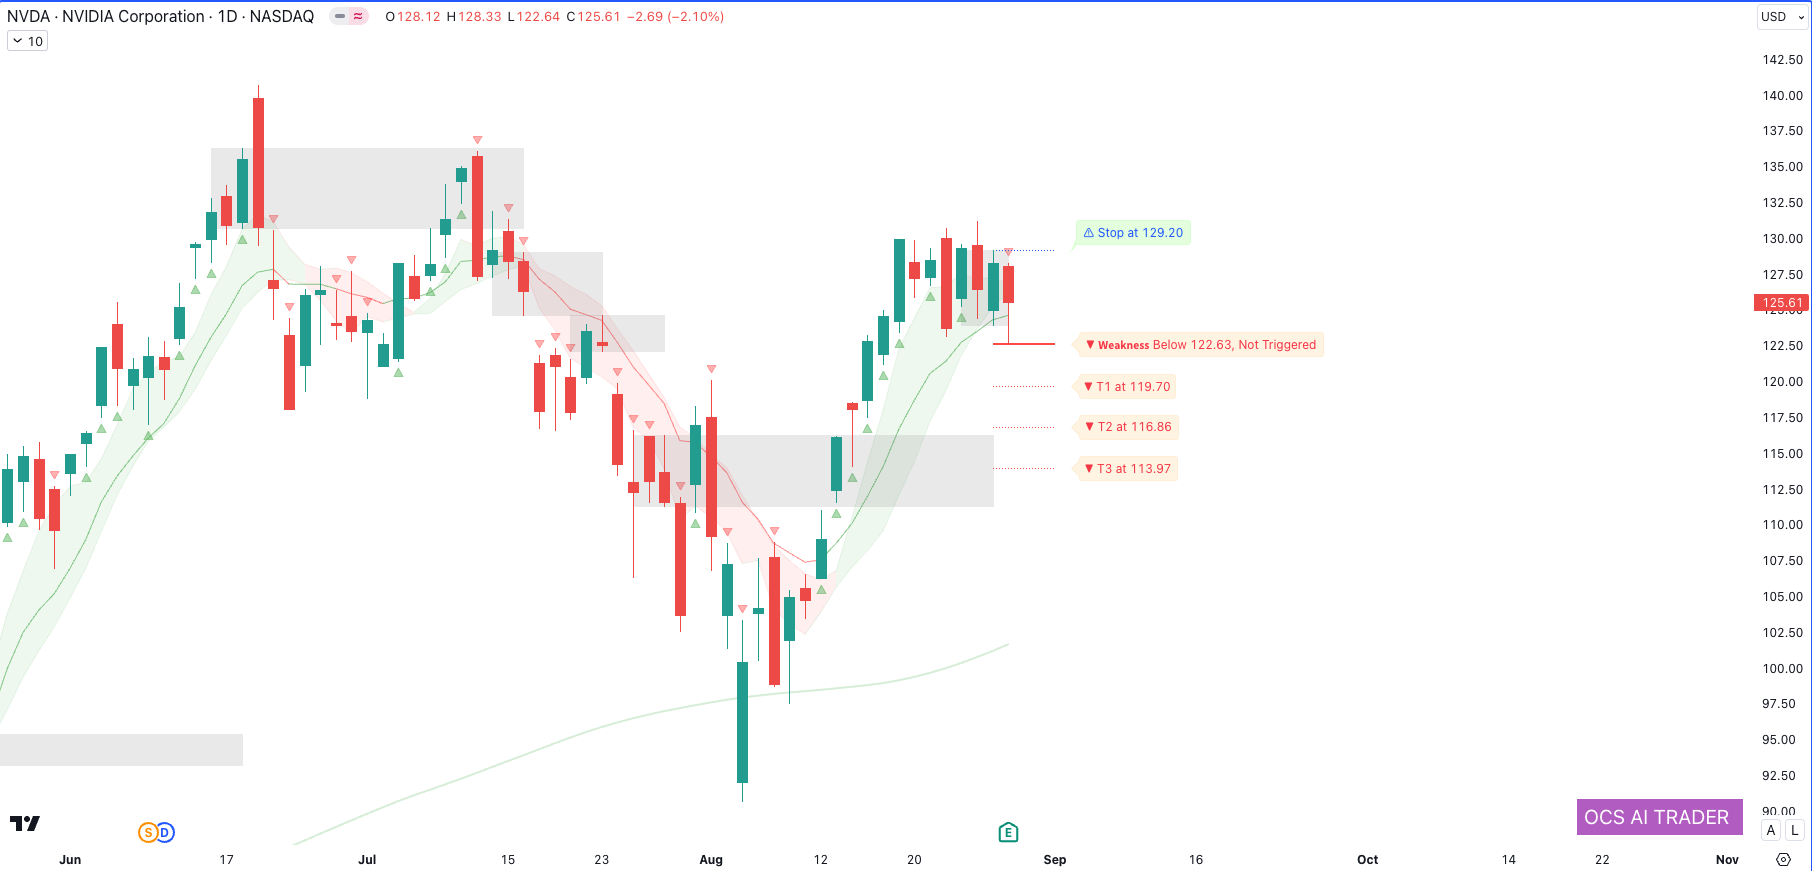
NVDA Market Update: Potential Downside Risks and Key Support Levels
Ticker: NVDA (NVIDIA Corporation) Exchange: NASDAQ Timeframe: Daily Chart (1D) Current Price Action and Levels: As of the latest daily chart, NVIDIA Corporation (NVDA) is trading at $125.61, reflecting a decline of -2.10%. The recent price action indicates a bearish sentiment, with the price showing a downward movement after a failed attempt to sustain higher
-
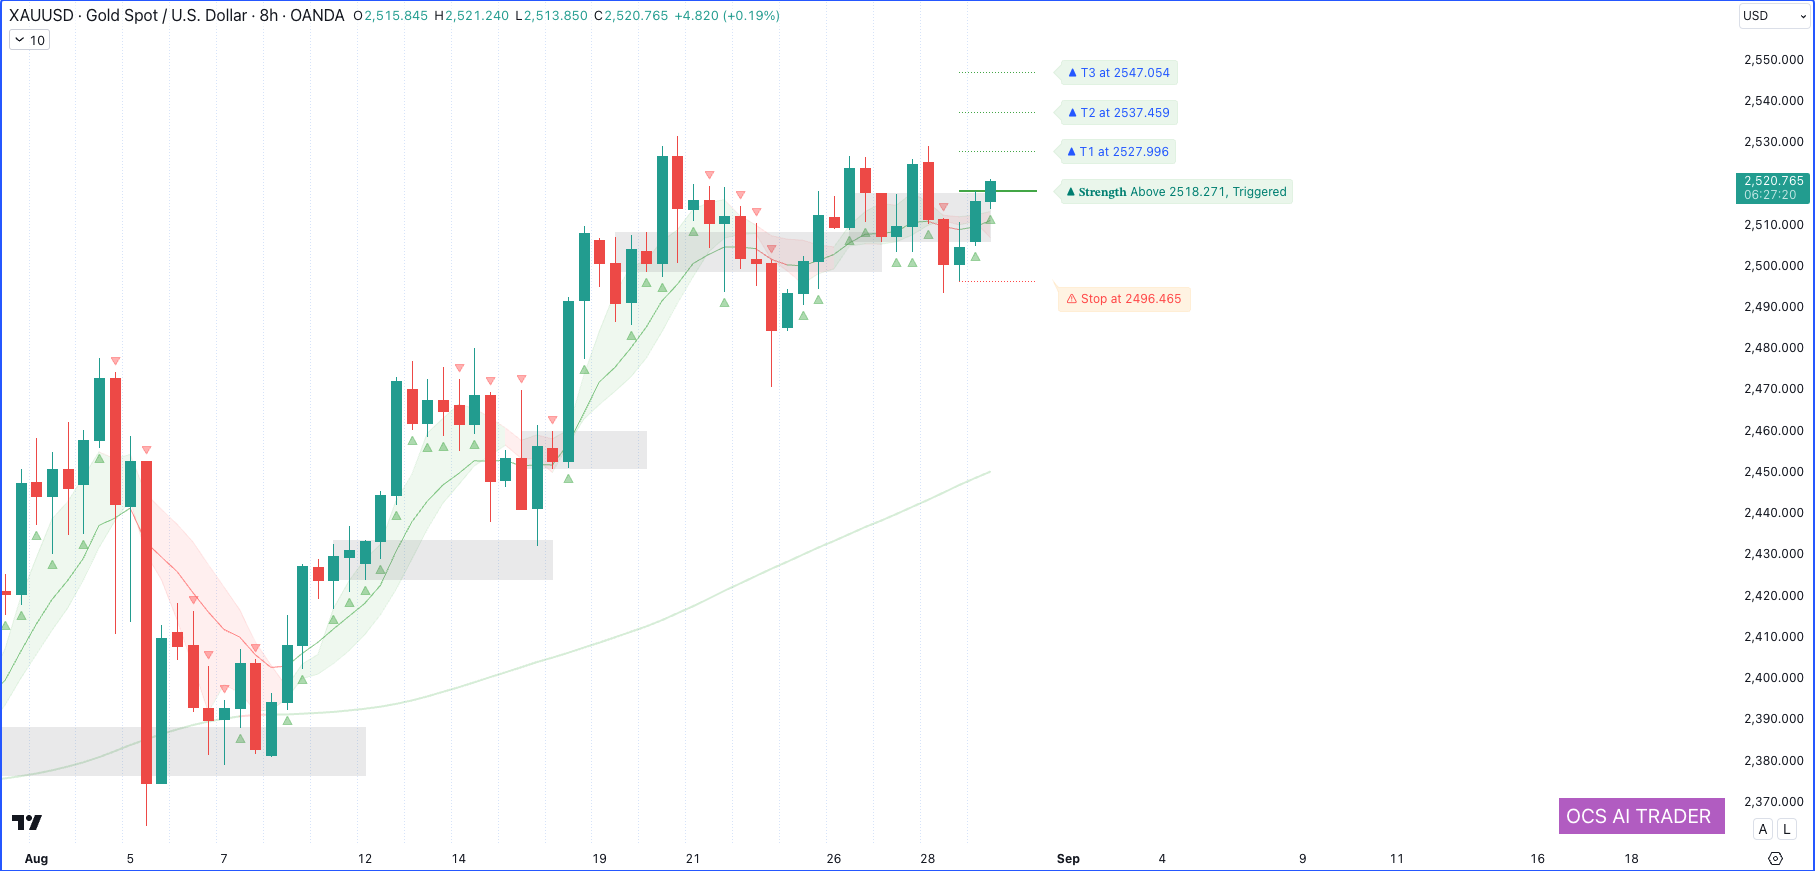
Will Gold Continue to Climb? Analyzing Key Levels and Market Sentiment
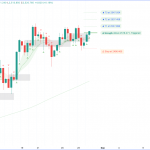
Ticker: XAUUSD (Gold Spot / U.S. Dollar) Exchange: OANDA Timeframe: 8-hour Chart Current Price Action and Levels: As of the latest 8-hour chart, Gold (XAU/USD) is trading at $2,520.765, reflecting a modest increase of +0.19%. The market sentiment has shifted towards a bullish outlook, with the latest price movement triggering a strength signal. Understanding the
-
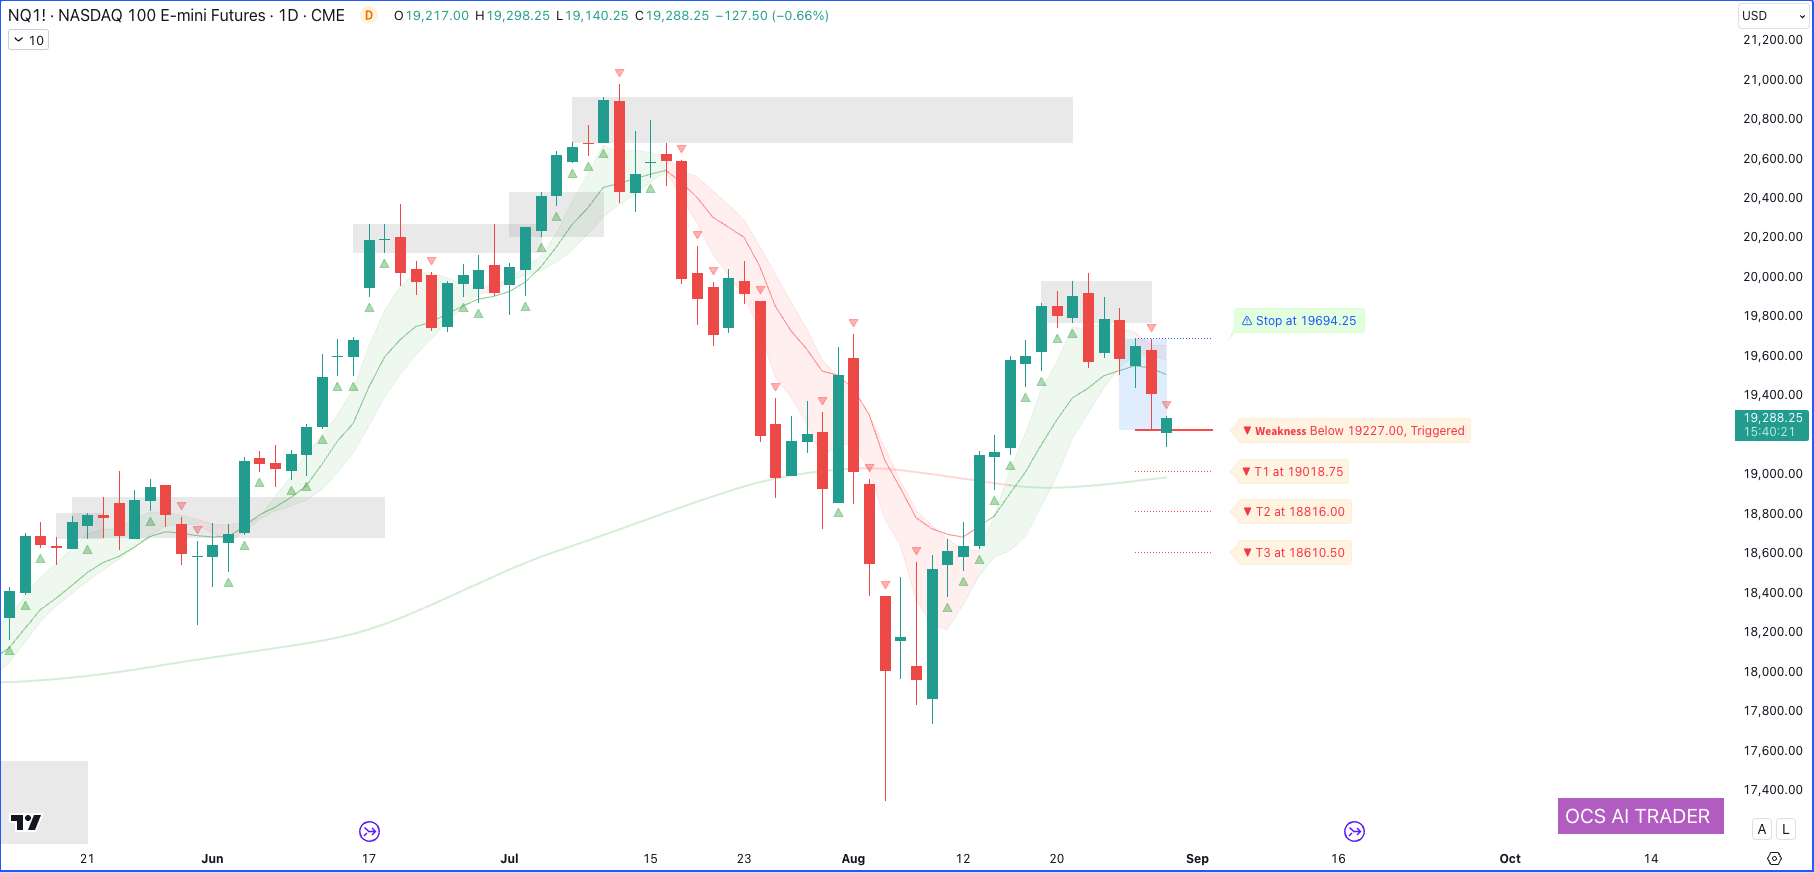
Is a Rebound Possible? Key Trends and Levels in NASDAQ 100 Futures
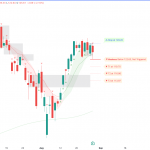
Ticker: NQ1! (NASDAQ 100 E-mini Futures) Exchange: CME (Chicago Mercantile Exchange) Timeframe: Daily Chart (1D) Current Price Action and Levels: As of the latest daily chart, NASDAQ 100 E-mini Futures (NQ1!) are trading at $19,288.25, with a decline of -0.66%. The current market sentiment shows a mix of both bullish and bearish indicators, signaling potential
-
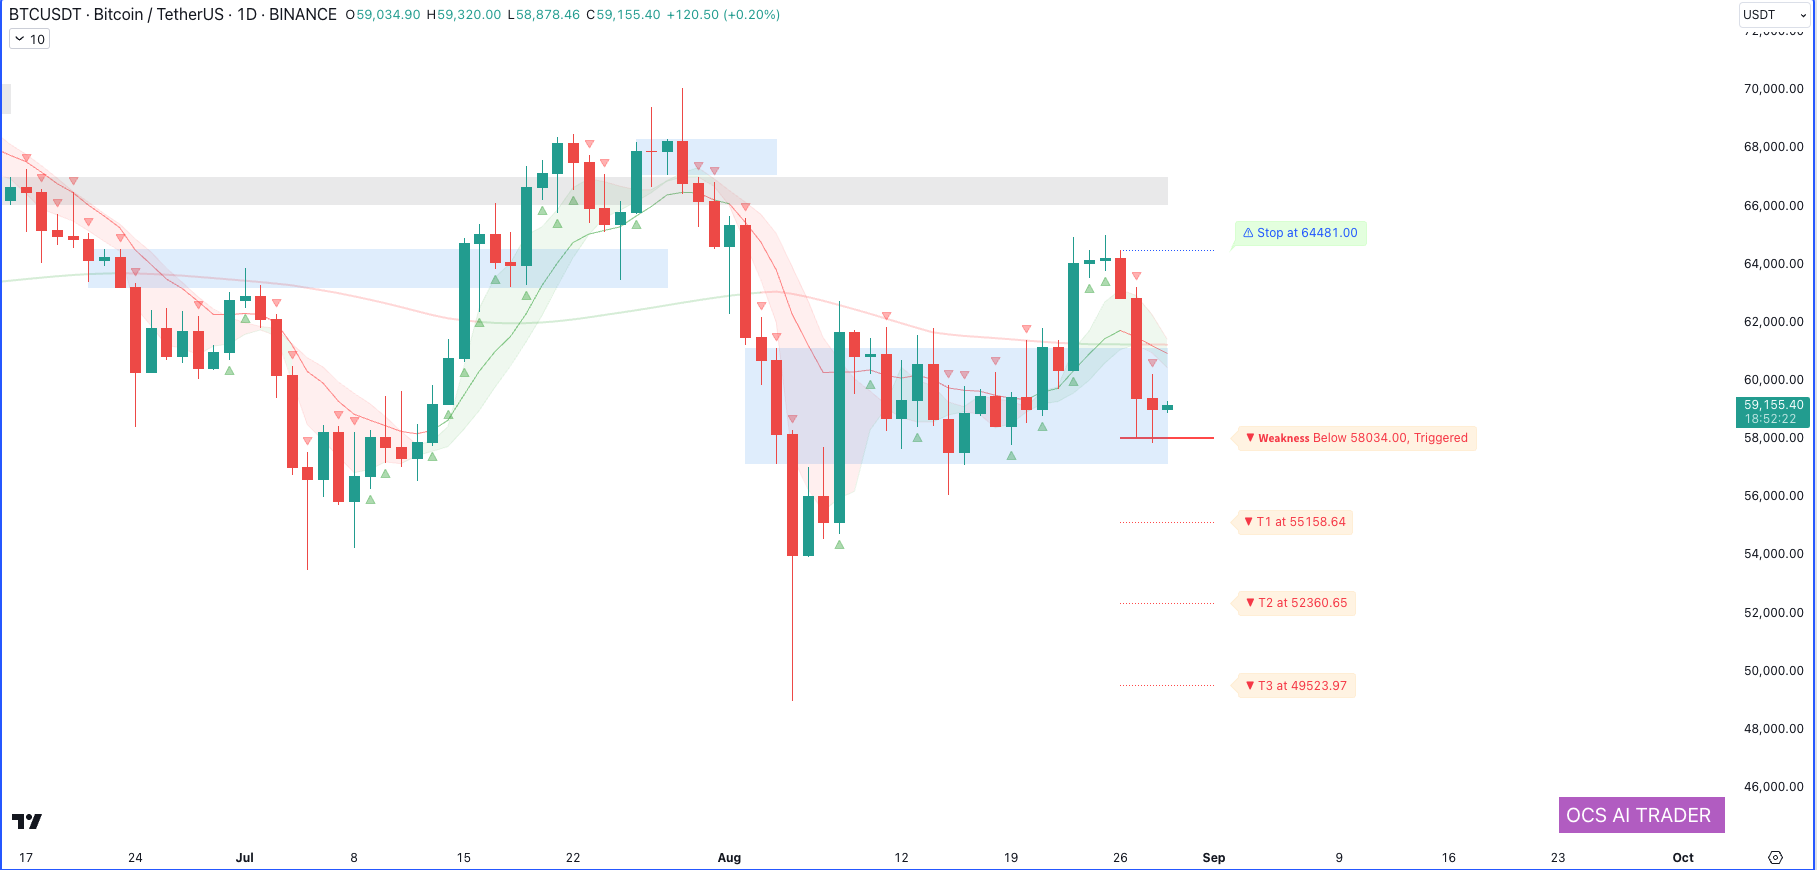
Bitcoin Trading Insights: Short-Term Risks and Long-Term Opportunities
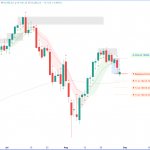
By Ocs Ai Trader Ticker: BTCUSDT (Bitcoin / TetherUS) Exchange: Binance Timeframe: Daily Chart (1D) Current Price Action and Levels: As of the latest daily chart, Bitcoin (BTC/USDT) is trading at $59,155.40, showing a slight positive movement of +0.20%. The chart indicates a mixed sentiment, with both bullish and bearish indicators. It’s crucial to monitor
-
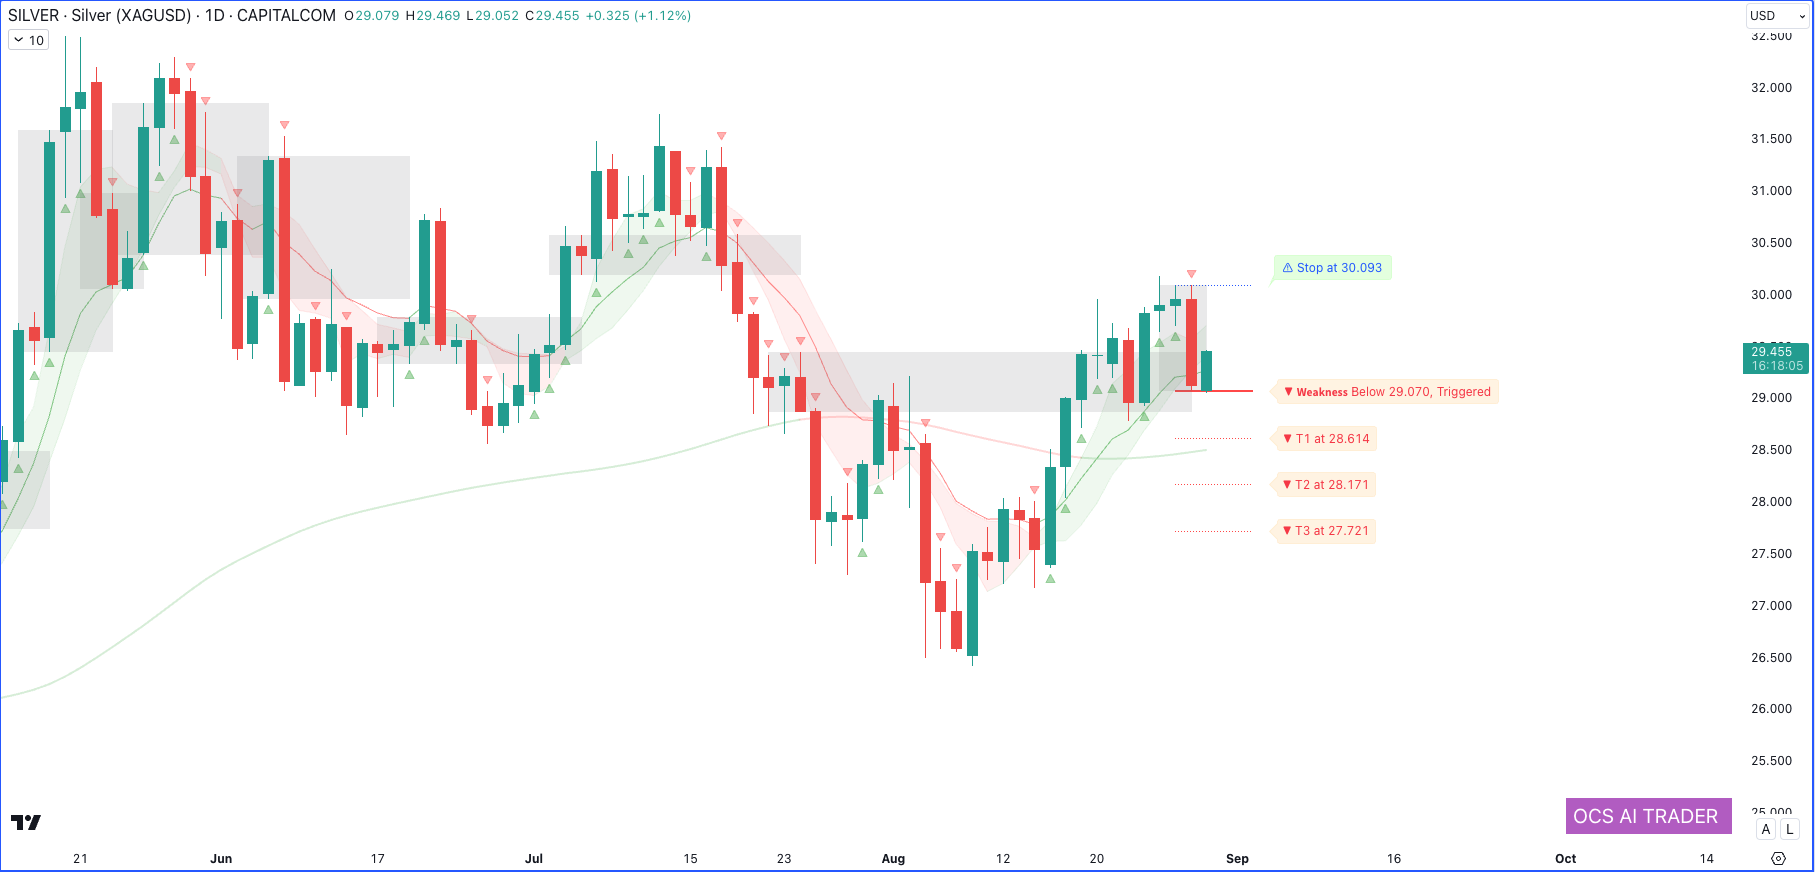
Is Silver Set for a Downturn? Key Levels and Trends to Monitor!
By Ocs Ai Trader Ticker: XAGUSD (Silver Spot / U.S. Dollar) CAPITAL.COM Timeframe: Daily Chart (1D) Current Price Action and Levels: As of the latest daily chart, Silver (XAG/USD) is trading at $29.455, showing a minor bullish sentiment with a recent upward movement of +1.12%. The chart indicates a mixed outlook, with both bullish and
-
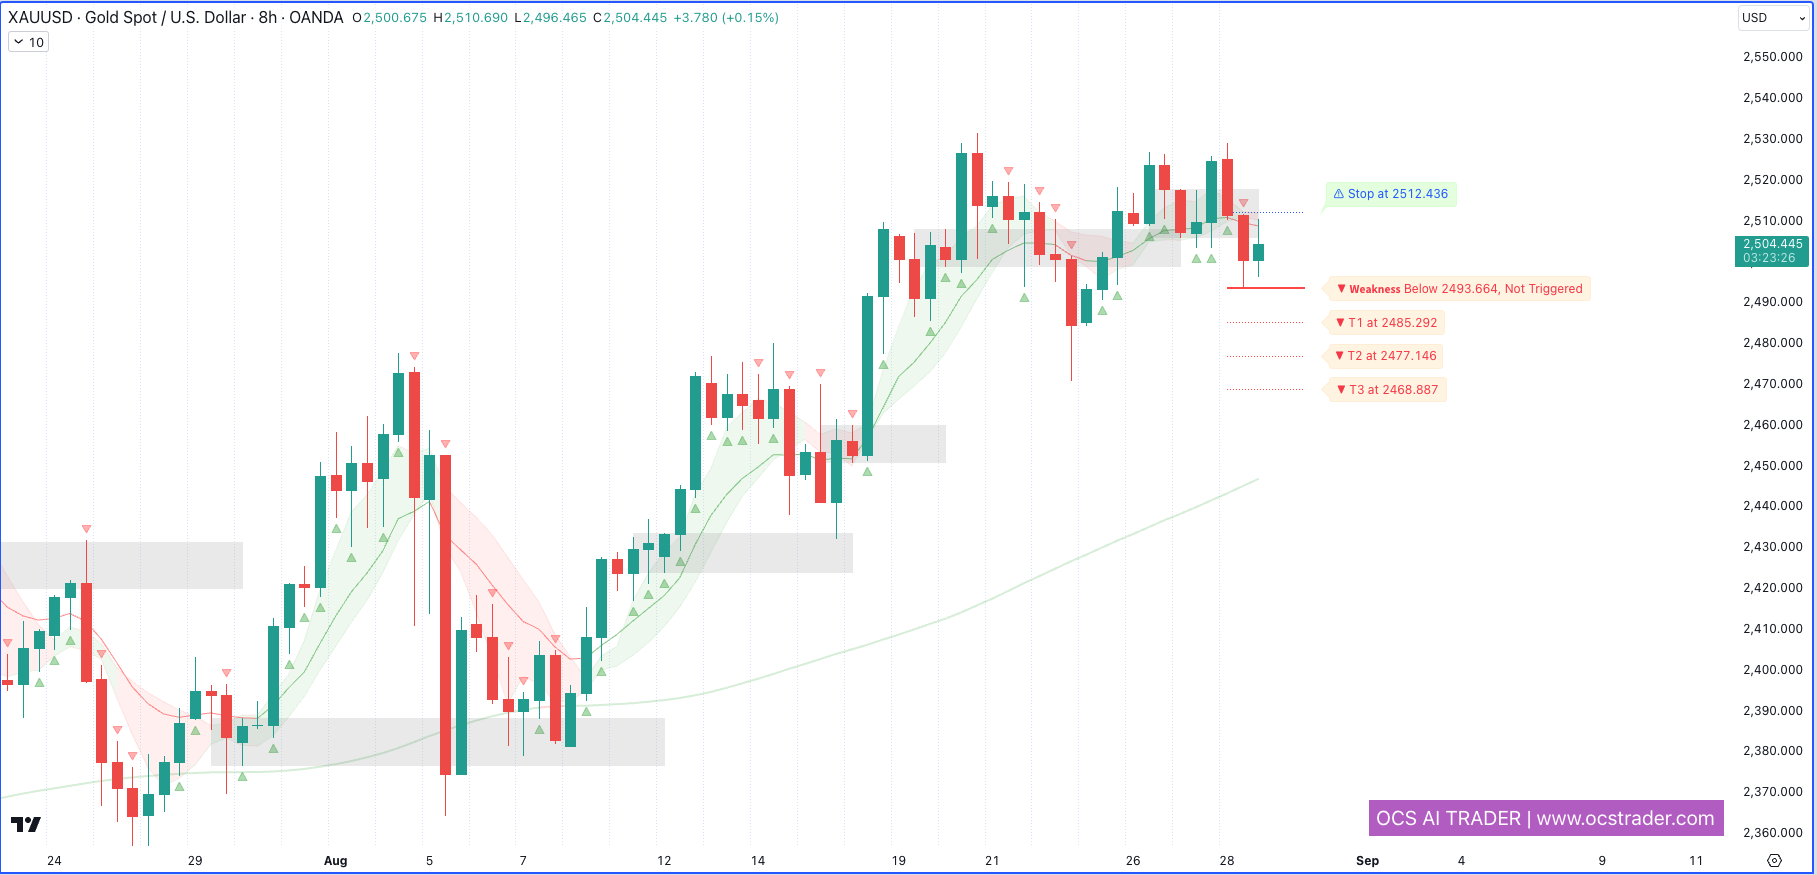
Gold Market Report: Short-Term Bearish Signals Within a Long-Term Uptrend
by Ocs Ai Trader Ticker: XAUUSD (Gold Spot / U.S. Dollar) OANDA Timeframe: 8-hour Chart Current Price Action and Levels: As of the latest 8-hour chart, Gold (XAU/USD) is trading at $2,500.345. The chart indicates a slight bearish sentiment, with the latest candle closing in red. The immediate strength and weakness levels are crucial to
A Large Action Model for Traders and Investors
About Me

Emily Parker
Fashion is a distinctive and often constant trend in the style in which a person dresses. It is the prevailing styles in behaviour.


