The Australian Fiscal Windfall: How a US Labor Shock Rewrote the AUD Narrative
Executive summary
The global macro landscape shifted violently on October 5, 2026, as a collision between domestic Australian fiscal anxiety and a staggering US labor market miss (29k payrolls) created a classic "dovish pivot" setup. While Australian Treasurer Jim Chalmers’ warnings about rising bond yields and debt-servicing costs initially cast a bearish pall over the Australian Dollar (AUD), the subsequent cratering of US Treasury yields effectively neutralized the threat.
This report traces the cascading impact of this divergence: from the immediate repricing of yield differentials to the non-obvious "Fiscal-Yield Reflexivity Loop" that is currently decoupling the AUD from its traditional commodity-price sensitivity. Investors are witnessing a rapid rotation where the AUD is transforming from a yield-starved laggard into a beneficiary of global interest-rate normalization. We analyze the resulting "Safe Haven" yield trap for US financials (XLF) and the stagflationary margin squeeze facing Australian resource-heavy equities.
Layer 1: Direct Impacts — The Fiscal Squeeze and the Labor Miss
The week opened with a dual-shock paradigm. On one side, Canberra’s fiscal reality: Treasurer Chalmers highlighted that the global rise in bond yields is no longer a theoretical concern but a direct, multi-billion-dollar hit to the Australian budget. This triggered immediate bearish pressure on the FXA (Australian Dollar ETF) and AUDUSD, as markets priced in the fiscal strain of higher debt-servicing costs.
Simultaneously, the US labor market delivered a shock: a meager 29k nonfarm payroll print. This data point is the primary catalyst for the current market recalibration. The direct impact was an instantaneous repricing of the FOMC terminal rate, forcing a sharp contraction in US 2Y yields. This effectively gutted the "higher-for-longer" yield premium that had been supporting the US Dollar (DXY) and pressuring the AUD.
AUDUSD/FXA: Initially pressured by fiscal pessimism, now oscillating as yield differentials compress.
DXY/UUP: Facing intense selling pressure as the US rate premium evaporates.
XLF: Reacting to the yield collapse with defensive, recession-wary positioning.
Layer 2: Secondary Effects — The Dovish Pivot and Sector Rotation
The 29k US payroll print acted as a circuit breaker for global risk sentiment. By signaling a cooling labor market, the data reduced the perceived risk of an aggressive, sustained Fed tightening cycle. This triggered a broad-based rotation:
Carry Trade Revival: As US yields cratered, the interest rate differential between the US and Australia—which had been widening in favor of the USD—began to narrow rapidly. This makes the AUD more attractive on a relative-yield basis, reversing the bearish pressure seen earlier in the week.
Defensive Rotation: In the US equity space, the fear of economic deceleration is driving a shift away from cyclicals and financials (XLF) toward defensive sectors (XLP, XLU). The market is moving from "inflation-hedging" to "recession-hedging."
Gold/Safe-Haven Bid: The decline in real interest rates is providing a tailwind for non-yielding assets like GLD, as investors seek protection against a potential US economic slowdown.
Layer 3: Macro Propagation — The Yield Compression Ripple
The macro propagation of this event is defined by the speed of global bond yield compression. As US 2Y yields fall faster than Australian yields, we are observing a structural shift in capital flows:
Currency Multiplier: The DXY weakness is acting as a force multiplier for the AUD. With the USD losing its yield premium, the AUD is capturing inflows from global investors seeking yield in a lower-rate environment.
Fiscal Credibility: Paradoxically, the global yield compression is a "fiscal windfall" for Canberra. By lowering the benchmark for sovereign debt issuance, the market is effectively doing the work that fiscal policy could not: making the Australian deficit appear more manageable.
Commodity-Linked Equity Divergence: While the stronger AUD is generally positive for the Australian economy, it creates a headwind for the export competitiveness of its resource-heavy sectors. This is creating a divergence between the currency (strength) and the mining/materials sector (margin pressure).
Layer 4: Non-Obvious Connections — The Reflexivity Loop
The most critical insight for institutional participants is the Australian Fiscal-Yield Reflexivity Loop.
Normally, fiscal strain (as cited by Chalmers) creates a bearish floor for a currency. However, in this specific macro environment, the L3 yield compression creates a positive feedback loop: lower global yields reduce Australian debt-servicing costs, which improves sovereign credit quality, which in turn supports the AUD, further lowering the cost of imported inflation. This loop is currently decoupling the AUD from its historical, high-beta commodity sensitivity.
Furthermore, we are seeing a Gold-AUD Decoupling. Historically, both move in lockstep as "risk-on" assets. Today, we see a divergence: AUD is acting as a proxy for "growth-recovery" (via the carry-trade revival), while GLD is acting as a pure "recession-hedge."
Finally, the "Safe Haven" Yield Trap for US Financials (XLF) is the most underpriced risk. The market is rotating into TLT (bonds) for safety, which drives yields down, which in turn cannibalizes the Net Interest Margin (NIM) for the financial sector. The market is underpricing the speed at which this "flight to safety" degrades the profitability of the banking system.
Unified OCS Chart Read
As of October 5, 2026, the OCS signal engine indicates a deferred capture for the primary FX universe (FXA, AUDUSD, DXY). Consequently, technical analysis below relies on price history and macro-flow correlation rather than real-time OCS liquidity delta.
FXA (Australian Dollar ETF):
Setup Read: The recent price history shows a bottoming attempt near $68.61 (Oct 1), with a recovery to $68.86. The RSI(14) at 32.34 suggests the asset was recently oversold, aligning with the "fiscal strain" narrative.
Levels to Watch: The $69.00 level remains a critical pivot. A sustained break above this would confirm the "fiscal windfall" thesis.
Invalidation: A return to the $68.36 low would signal that the fiscal strain narrative is overpowering the yield-compression tailwind.
UUP (US Dollar ETF):
Setup Read: UUP is showing signs of exhaustion after a strong run. The RSI(14) at 72.55 indicates overbought conditions, confirming the "DXY weakness" thesis as the market prices in the dovish Fed pivot.
Levels to Watch: $28.84 (recent support) is the line in the sand. A break below this would accelerate the USD decline.
XLF (Financials):
Setup Read: The RSI(14) of 25.58 is deeply oversold, reflecting the "Safe Haven yield trap." The MACD is negative (-0.99), indicating strong downward momentum.
Levels to Watch: $53.21 is the critical support. A break below this would confirm the market's aggressive rotation into defensive assets.
Security-by-Security Analysis
FXA (Australian Dollar ETF)
Fig. 1 FXA — Signals + Liquidity · open full sizeFig. 2 FXA — Delta + Technical · open full sizeFXA — Unified OCS chart read
Executive Summary
The FXA profile is currently in a state of structural exhaustion and liquidity tangling. While the previous 'Weakness Below' signal from Chart 1 — Signals + Liquidity has successfully booked all five price targets, the immediate price action is caught between a bearish momentum band and emerging positive delta/liquidity rhythms noted in Chart 2 — Delta + Technical. The lack of clear Delta Force and the presence of 'tangled' liquidity cycles suggest a period of consolidation or indecision.
OCS Confluence
Grade
Directional Bias
Participation State
hands-off
neutral
exhausted
Setup Read: FXA is exhibiting an exhausted bearish setup with all primary targets booked, currently transitioning through a period of tangled liquidity and mixed delta pressure.
Confirmations
Price is currently navigating a zone of structural uncertainty (Chart 2 — Delta + Technical) following the completion of the prior bearish move (Chart 1 — Signals + Liquidity).
Both charts indicate a transition state: Chart 1 shows an 'exhausted' setup with all targets booked, while Chart 2 notes 'tangled' liquidity cycles and 'mixed' CVD pressure.
Contradictions
Chart 1 — Signals + Liquidity identifies a bearish momentum band and pink weakness cycle, whereas Chart 2 — Delta + Technical notes recent green CVD columns and a positive liquidity band suggesting a buying rhythm.
Structural failure occurs upon a breach of the 71.34 invalidation level (Chart 1 — Signals + Liquidity).
Risk Notes
High risk due to tangled liquidity cycles and uncertain liquidity bands (Chart 2 — Delta + Technical).
Setup exhaustion following the completion of the 'Weakness Below' cycle (Chart 1 — Signals + Liquidity).
Potential for chop as delta force is currently absent (Chart 2 — Delta + Technical).
FXA — Signals + Liquidity (click to expand)
Visible Context
Symbol
Timeframe
Layout Confidence
FXA
1D
high
Signal Engine
Direction
Declaration
Trigger
Trigger Status
Stop / Invalidation
SHORT
Weakness Below
N/A
Triggered
71.34
Target Ladder
T1
T2
T3
T4
T5
Booked
Next Unbooked
70.73 (Booked)
70.47 (Booked)
70.21 (Booked)
69.43 (Booked)
68.96 (Booked)
T1, T2, T3, T4, T5
all booked
Structure Context
Float-Volume Zones
Momentum Band
Dominant Cycle
Price Location
Structural Context
Price is rejecting a pink extreme float-volume zone at the top of the recent move.
weakness (price is interacting with a pink weakness band)
bearish (pink ribbon showing active negative cycle pressure)
Price is currently above the historical booked targets but below the most recent pink resistance zone.
The setup is exhausted as all declared targets from the Weakness Below signal have been reached and booked.
Setup Read
State
R:R to T1
R:R to Furthest
Invalidation
Evidence Quality
Notes
exhausted
N/A
N/A
Stop at 71.34
high
Price is currently rejecting a pink weakness band and a pink extreme float-volume zone, following a 'Weakness Below' declaration that has already seen multiple targets booked.
FXA — Delta + Technical (click to expand)
OCS Layout Presence
Delta Configuration Badge
Delta Histogram / CVD
Liquidity Overlay / Cycle
Ocs Ai Trader | Delta Configuration
green and red CVD columns at the bottom panel
stepped liquidity lines and shaded liquidity bands on the price chart
Liquidity Engine
Active Band
Vs Slow Liquidity
Vs Fast Liquidity
Cycle State
Divergence
Hands-Off Risk
uncertain liquidity band at recent price levels
at slow positive line
at fast positive/negative transition
tangle
none
high due to tangled liquidity cycles and uncertain liquidity band
Delta Engine
CVD Pressure
Dominant Cycle Leader
Adaptive Filter
Delta Force
Exhaustion Boundary
mixed
tangled
mixed
absent
none
Secondary TA
EMA
RSI
MACD
EMA 1: 69.32, EMA 21: 69.86
RSI 14 close: 62.52, 55.43
MACD 12 26 9: 0.2269, +0.4347, -0.2208
Confluence
Setup Type
Directional Bias
Conviction
Confirmation
Contradiction
Key Level
hands-off
neutral
low
Positive liquidity band and recent green CVD columns suggest buying rhythm.
The fast and slow liquidity cycles are tangled and price is interacting with the transition zone.
69.00
* **Price:** $68.86 (+0.37%)
* **Analysis:** The currency is caught between two forces: the domestic fiscal reality (negative) and the global yield-compression windfall (positive). The current price action suggests the market is beginning to favor the latter. The "fiscal windfall" loop is the key driver to watch.
* **Risk:** If the RBA is forced to maintain a hawkish stance despite global trends, the AUD could face a "policy-divergence" shock.
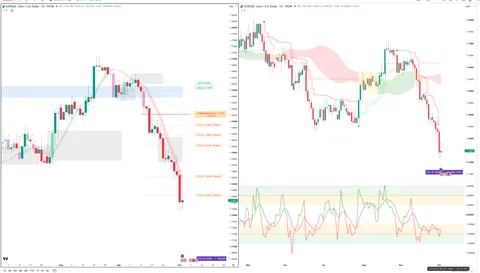
AUDUSD
Fig. 3 AUDUSD — Signals + Liquidity · open full sizeFig. 4 AUDUSD — Delta + Technical · open full sizeAUDUSD — Unified OCS chart read
Executive Summary
The consensus direction for AUDUSD is bearish, characterized by a high-conviction trend-continuation setup. Price is currently navigating a structural weakness phase, rejecting the extreme red float-volume zone (Chart 1) while simultaneously exhibiting net selling pressure and negative CVD columns (Chart 2). The setup is currently in an active state, targeting the final unbooked T5 liquidity level as price remains below both fast and slow negative liquidity lines.
OCS Confluence
Grade
Directional Bias
Participation State
high
bearish
active
Setup Read: AUDUSD maintains a bearish trend-continuation profile as price rejects upper volume extremes amid sustained negative delta and liquidity pressure.
Confirmations
Bearish trend alignment: Price is trending below the dominant cycle ribbon (Chart 1) and within a negative dominant delta cycle (Chart 2).
Momentum confirmation: Price is trading within the pink momentum weakness band (Chart 1) and a negative liquidity band (Chart 2).
Volume/Delta synergy: Price is rejecting the red extreme float-volume zone (Chart 1) while exhibiting net selling and red CVD columns (Chart 2).
Pink Shaded Area (Negative Liquidity Band) [Chart 2]
Invalidation
Structural failure occurs if price breaches the 0.71551 trigger/invalidation level (Chart 1).
Risk Notes
Approaching terminal T5 target may lead to localized exhaustion.
Low hands-off risk indicated by alignment of delta and liquidity engines.
AUDUSD — Signals + Liquidity (click to expand)
Visible Context
Symbol
Timeframe
Layout Confidence
AUDUSD
1D
high
Signal Engine
Direction
Declaration
Trigger
Trigger Status
Stop / Invalidation
SHORT
Weakness Below
0.71551
Triggered
0.71551
Target Ladder
T1
T2
T3
T4
T5
Booked
Next Unbooked
0.71183
0.70824
0.70461
0.69570
0.68705
T3, T4
0.68705
Structure Context
Float-Volume Zones
Momentum Band
Dominant Cycle
Price Location
Structural Context
Price is rejecting the red extreme float-volume zone near 0.71551/0.71600.
weakness; price is trading within the pink momentum weakness band.
bearish; price is trending below the pink cycle ribbon with downward slope.
Price is below the trigger (0.71551) and T1/T2/T3, currently between T4 (booked) and T5 (unbooked).
The setup is clean as price maintains momentum within the weakness band and is trending toward the final unbooked target.
Setup Read
State
R:R to T1
R:R to Furthest
Invalidation
Evidence Quality
Notes
active
N/A
N/A
0.71551
high
Price is currently rejecting the pink weakness band and extreme float-volume zone, trending below the dominant-cycle ribbon towards unbooked T5.
AUDUSD — Delta + Technical (click to expand)
OCS Layout Presence
Delta Configuration Badge
Delta Histogram / CVD
Liquidity Overlay / Cycle
Ocs Ai Trader | Delta Configuration
Red and green CVD/volume columns at the bottom of the chart
Pink and light blue liquidity bands overlaid on price
Liquidity Engine
Active Band
Vs Slow Liquidity
Vs Fast Liquidity
Cycle State
Divergence
Hands-Off Risk
negative, price is within the pink shaded area
below slow negative liquidity line
below fast negative liquidity line
N/A
none
low
Delta Engine
CVD Pressure
Dominant Cycle Leader
Adaptive Filter
Delta Force
Exhaustion Boundary
net selling
negative
N/A
absent
none
Secondary TA
EMA
RSI
MACD
EMA 50 (red) and EMA 200 (blue) are visible
RSI is visible below the main price pane
MACD is visible below RSI
Confluence
Setup Type
Directional Bias
Conviction
Confirmation
Contradiction
Key Level
trend-continuation short
bearish
medium
Price is currently within a negative liquidity band accompanied by a negative dominant delta cycle and red CVD columns.
None visible
0.69532
* **Analysis:** The pair is the primary battleground for the Fed vs. RBA divergence. The 29k NFP print has significantly lowered the bar for a Fed pivot, which is the single most bullish factor for AUDUSD.
* **Risk:** Watch for any hawkish rhetoric from the Fed that could re-inflate the USD premium.
DXY (US Dollar Index)
Fig. 5 DXY — Signals + Liquidity · open full sizeFig. 6 DXY — Delta + Technical · open full sizeDXY — Unified OCS chart read
Executive Summary
The DXY presents a conflicting setup characterized by a bullish delta-liquidity profile (Chart 2 — Delta + Technical) clashing with neutral structural resistance (Chart 1 — Signals + Liquidity). While the Delta Engine shows net buying and alignment above fast/slow liquidity lines, price remains trapped within a pink extreme float-volume resistance zone near 101.000-101.500. The consensus suggests a high-conviction delta move attempting to breach a structural supply ceiling.
OCS Confluence
Grade
Directional Bias
Participation State
medium
bullish
pre-trigger
Setup Read: The DXY is exhibiting bullish delta-liquidity alignment while simultaneously testing a significant structural resistance zone, creating an unresolved participation state.
Confirmations
Price is currently interacting with significant structural zones near the 101.000-101.500 range (Chart 1 — Signals + Liquidity).
Both charts indicate price is currently in a transitionary phase involving momentum shifts and liquidity alignment (Chart 1 & Chart 2).
Contradictions
Chart 1 — Signals + Liquidity identifies a 'neutral' declaration with price in a 'pink weakness' zone/resistance, while Chart 2 — Delta + Technical identifies a 'bullish' trend-continuation bias with net buying pressure.
101.817 - EMA Resistance (Chart 2 — Delta + Technical)
101.433 - EMA Support (Chart 2 — Delta + Technical)
Invalidation
Structural failure occurs if price breaches the catastrophic stop level located below the current pink weakness/resistance structure (Chart 1 — Signals + Liquidity).
Risk Notes
High resistance/weakness zone friction (Chart 1)
Momentum oscillation between strength and weakness bands (Chart 1)
Potential exhaustion near RSI 70 levels (Chart 2)
DXY — Signals + Liquidity (click to expand)
Visible Context
Symbol
Timeframe
Layout Confidence
DXY - U.S. Dollar Index
1D
high
Signal Engine
Direction
Declaration
Trigger
Trigger Status
Stop / Invalidation
NEUTRAL
no visible declaration
N/A
N/A
N/A
Target Ladder
T1
T2
T3
T4
T5
Booked
Next Unbooked
N/A
N/A
N/A
N/A
N/A
None
N/A
Structure Context
Float-Volume Zones
Momentum Band
Dominant Cycle
Price Location
Structural Context
Price is currently inside a pink extreme float-volume/strongest resistance zone near 101.000-101.500.
mixed; price is oscillating between the pink weakness band and the green strength band.
transition / stabilizing with a flattening ribbon visual near current price.
Current price is within the pink weakness band, below the most recent peak and within a pink float-volume zone.
The setup is conflicting as price resides in a resistance zone while the momentum bands and cycle ribbon show stabilizing behavior.
Setup Read
State
R:R to T1
R:R to Furthest
Invalidation
Evidence Quality
Notes
unclear
N/A
N/A
catastrophic stop level below the current price structure.
high
Price is currently testing the pink weakness momentum band after a failed attempt to maintain structure above the previous float-volume zone.
DXY — Delta + Technical (click to expand)
OCS Layout Presence
Delta Configuration Badge
Delta Histogram / CVD
Liquidity Overlay / Cycle
Ocs Ai Trader | Delta Configuration
N/A
visible positive liquidity band and stepped liquidity lines
Liquidity Engine
Active Band
Vs Slow Liquidity
Vs Fast Liquidity
Cycle State
Divergence
Hands-Off Risk
positive liquidity band with price trending upward
above slow positive liquidity line
above fast positive liquidity line
fast and slow liquidity lines are aligned in a bullish cross/upward trajectory
Price is currently situated within a positive liquidity band and has recently crossed above both fast and slow positive liquidity lines, aligned with a positive dominant delta cycle.
None visible.
102.433
* **Analysis:** The DXY is currently the primary barometer for the "higher-for-longer" trade. The current weakness is a direct reflection of the market's realization that the US labor market cannot sustain current rate levels.
XLF (Financials)
Fig. 7 XLF — Signals + Liquidity · open full sizeFig. 8 XLF — Delta + Technical · open full sizeXLF — Unified OCS chart read
Executive Summary
The consensus outlook for XLF is bearish, characterized by high-conviction trend continuation. While the primary target ladder has been fully realized (Chart 1), the underlying delta and liquidity engines remain aggressively negative, with Chart 2 noting net selling accumulation and price trading below all key liquidity lines. The current state reflects a structural retracement into supply following a significant breakdown.
OCS Confluence
Grade
Directional Bias
Participation State
high
bearish
active
Setup Read: XLF exhibits a high-conviction bearish structure as price rejects volume extremes while maintaining negative delta and liquidity alignment.
Confirmations
Bearish structural dominance: Chart 1 identifies a weakness momentum band and bearish cycle, while Chart 2 confirms negative delta cycles and net selling CVD.
Liquidity/Volume alignment: Price is rejecting a red extreme float-volume zone (Chart 1) while remaining below both fast and slow negative liquidity lines (Chart 2).
Trend state: Both charts identify a consistent bearish momentum profile with no visible contradictions in directional force.
Contradictions
(none)
Levels To Watch
57.63 (Stop / Invalidation - Chart 1)
57.80 (Red Extreme Float-Volume Zone - Chart 1)
53.00 (Key Level / Target - Chart 2)
57.25 (Original Trigger Level - Chart 1)
Invalidation
Structural failure occurs if price breaches the 57.63 invalidation level (Chart 1).
Risk Notes
Setup exhaustion: All primary declared targets (T1-T5) have been booked (Chart 1).
Retracement risk: Current price action is trading within a zone suggesting a move into supply (Chart 1).
XLF — Signals + Liquidity (click to expand)
Visible Context
Symbol
Timeframe
Layout Confidence
XLF
1D
high
Signal Engine
Direction
Declaration
Trigger
Trigger Status
Stop / Invalidation
SHORT
Weakness Below
57.25
Triggered
57.63
Target Ladder
T1
T2
T3
T4
T5
Booked
Next Unbooked
57.05 (Booked)
56.76 (Booked)
56.51 (Booked)
55.77 (Booked)
55.32 (Booked)
T1, T2, T3, T4, T5
N/A
Structure Context
Float-Volume Zones
Momentum Band
Dominant Cycle
Price Location
Structural Context
Price is currently rejecting a red extreme float-volume zone near 57.80
weakness; price is trading within the pink momentum band
bearish; pink ribbon is active and expanding below price
Price is below the trigger (57.25) and between the stop (57.63) and the last booked target (55.32)
The setup is crowded as all declared targets (T1-T5) have already been booked, suggesting the current move is a retracement into supply.
Setup Read
State
R:R to T1
R:R to Furthest
Invalidation
Evidence Quality
Notes
active
N/A
N/A
Stop at 57.63
high
Price is rejecting a red extreme float-volume zone and trading within a pink weakness momentum band following a breakdown of structural support.
XLF — Delta + Technical (click to expand)
OCS Layout Presence
Delta Configuration Badge
Delta Histogram / CVD
Liquidity Overlay / Cycle
Ocs Ai Trader | Delta Configuration
Red CVD columns indicating net selling accumulation and red delta-force arrows
Negative liquidity band (shaded red) and stepped liquidity lines
Liquidity Engine
Active Band
Vs Slow Liquidity
Vs Fast Liquidity
Cycle State
Divergence
Hands-Off Risk
negative, price is currently in the bearish zone
below slow negative liquidity line
below fast negative liquidity line
fast/slow cycle alignment (both negative)
none
low
Delta Engine
CVD Pressure
Dominant Cycle Leader
Adaptive Filter
Delta Force
Exhaustion Boundary
net selling
negative
bearish ceiling
recent red arrows
none
Secondary TA
EMA
RSI
MACD
EMA 9 and EMA 21 are visible
RSI is visible
MACD is visible
Confluence
Setup Type
Directional Bias
Conviction
Confirmation
Contradiction
Key Level
trend-continuation short
bearish
high
Price is below both fast and slow liquidity lines within a negative liquidity band, coinciding with negative delta cycles and CVD.
None visible
53.00
* **Analysis:** XLF is the "yield trap" victim. As the market prices in a recessionary environment (via the labor data), the yield curve is flattening, which is toxic for bank profitability.
* **Risk:** Regulatory enforcement actions (as noted in the Fed enforcement with Ontario Bancorporation) add an idiosyncratic layer of risk to the sector.
GLD (Gold)
Fig. 9 GLD — Signals + Liquidity · open full sizeFig. 10 GLD — Delta + Technical · open full sizeGLD — Unified OCS chart read
Executive Summary
The consensus direction is bearish, characterized by a state of local exhaustion following the completion of a major downside move. While Chart 1 — Signals + Liquidity notes that all five primary downside targets have been booked, Chart 2 — Delta + Technical confirms sustained selling pressure via net negative CVD and price trading below both slow and fast negative liquidity lines. The current regime is defined by a struggle for new structure as price oscillates in a weakness band near historical volume zones.
OCS Confluence
Grade
Directional Bias
Participation State
medium
bearish
exhausted
Setup Read: GLD exhibits a bearish structural profile with completed downside targets and ongoing negative delta, though current price action shows signs of local exhaustion within a weakness band.
Selling pressure confirmation: Chart 1's weakness band positioning is corroborated by Chart 2's net selling CVD pressure.
Structural bearishness: Chart 1's price rejection at upper volume zones aligns with Chart 2's price sitting below both slow and fast negative liquidity lines.
Structural failure occurs if price breaches the 395.58 level (Chart 1 — Signals + Liquidity).
Risk Notes
Exhaustion risk: Price has already fulfilled all visible downside targets (Chart 1 — Signals + Liquidity).
Tangled cycle state: Transitionary price action near liquidity levels suggests potential chop (Chart 2 — Delta + Technical).
Medium risk due to tangled cycle lines and transition near levels (Chart 2 — Delta + Technical).
GLD — Signals + Liquidity (click to expand)
Visible Context
Symbol
Timeframe
Layout Confidence
GLD
1D
high
Signal Engine
Direction
Declaration
Trigger
Trigger Status
Stop / Invalidation
SHORT
Weakness Below
391.86
Triggered
395.58
Target Ladder
T1
T2
T3
T4
T5
Booked
Next Unbooked
390.24 (Booked)
387.67 (Booked)
385.28 (Booked)
384.35 (Booked)
379.35 (Booked)
T1, T2, T3, T4, T5
N/A
Structure Context
Float-Volume Zones
Momentum Band
Dominant Cycle
Price Location
Structural Context
Price is rejecting the red extreme float-volume zone at 425.00-430.00 and sits below a gray average volume zone near 395.00.
weakness (price is within the pink momentum band)
bearish (pink ribbon active and descending)
Price is below the trigger (391.86), below the stop (395.58), and currently trading between 390.00 and 395.00.
The setup is clean as all five downside targets are marked as booked, suggesting the current price action is searching for new structure or retracement.
Setup Read
State
R:R to T1
R:R to Furthest
Invalidation
Evidence Quality
Notes
exhausted
N/A
N/A
391.86
high
Price is currently oscillating within a pink weakness band and approaching a red extreme float-volume resistance zone after failing to hold recent support levels.
GLD — Delta + Technical (click to expand)
OCS Layout Presence
Delta Configuration Badge
Delta Histogram / CVD
Liquidity Overlay / Cycle
Ocs Ai Trader | Delta Configuration
Red and green CVD columns located in the bottom panel showing recent red selling pressure.
Visible liquidity bands (red/green/purple) and cycle lines overlaying the price action.
Liquidity Engine
Active Band
Vs Slow Liquidity
Vs Fast Liquidity
Cycle State
Divergence
Hands-Off Risk
negative with latest price at 381.14
below slow negative liquidity line
below fast negative liquidity line
tangle
none
medium due to tangled cycle lines and transition near levels
Delta Engine
CVD Pressure
Dominant Cycle Leader
Adaptive Filter
Delta Force
Exhaustion Boundary
net selling
negative
bearish ceiling
absent
none
Secondary TA
EMA
RSI
MACD
EMA 9: 385.81, EMA 21: 385.81
RSI 14 close: 38.81, RSI 14: 43.71
MACD close: -5.14, MACD 12 26 9: -5.14, -3.15
Confluence
Setup Type
Directional Bias
Conviction
Confirmation
Contradiction
Key Level
trend-continuation short
bearish
medium
Price is trading within a negative liquidity band with recent red CVD columns indicating net selling accumulation.
None visible
381.14
* **Analysis:** Gold is benefiting from the decline in real yields. It is currently the primary beneficiary of the "recession-hedge" rotation.
* **Risk:** If the "Fiscal-Yield Reflexivity Loop" leads to a sudden, disorderly repricing of risk, gold could see a liquidity-driven sell-off despite the macro thesis.
Historical Parallels
The current environment bears a striking resemblance to the Q3 2019 "Powell Pivot" period. Then, as now, the market was grappling with slowing global growth and a Fed that was forced to pivot from a tightening bias to a more accommodative stance. In late 2019, the rapid compression of US yields led to a sharp rally in high-beta currencies like the AUD and a significant rotation into defensive equity sectors. The key difference today is the added layer of "fiscal strain" in Australia, which makes the current AUD recovery more fragile and dependent on the "reflexivity loop" holding firm.
Outlook & Risk Matrix
Short-Term (1-5 Days)
Base Case: Continued AUD strength as the market fully prices in the dovish Fed pivot. DXY weakness to persist.
Bear Case: A "fiscal credibility" crisis in Australia (if bond yields spike again) could cause a disorderly sell-off in FXA, overriding the yield-compression tailwind.
Medium-Term (1-4 Weeks)
Base Case: The "Fiscal-Yield Reflexivity Loop" stabilizes the AUD, allowing it to decouple from commodity price volatility. XLF remains under pressure as the market prices in a lower-rate, recessionary environment.
Risk Matrix:
High Probability: Continued DXY weakness, AUD strength, XLF underperformance.
Low Probability (Tail Risk): A "Sovereign Debt Feedback" shock where Australian fiscal strain outweighs the yield-compression benefits, leading to a massive, disorderly repricing of the AUD.
What to Watch
US Treasury Yields: The primary driver of the DXY weakness. Watch the 2Y-10Y spread for signs of a deeper recessionary signal.
Australian Bond Auctions: Any sign of weak demand would directly challenge the "Fiscal Windfall" thesis and re-ignite fiscal anxiety.
Fed Speaker Schedule: Any pushback against the "dovish pivot" narrative will cause an immediate, violent reversal in the AUDUSD carry trade.
Energy Prices (WTI): The "Energy-induced stagflation trap" for Australian Materials. If WTI spikes, it will squeeze the margins of Australian miners, regardless of the AUD strength.
Education and market research only, not financial advice. Charts are OCS AI Trader readings at the time of writing and change with new bars.