Khor Mor Disruption: Energy Supply Shocks and the Valuation Multiplier Compression Cascade
Executive summary
The suspension of production at the Khor Mor gas field in Iraq, following a precise drone strike, has acted as a catalyst for a structural repricing of geopolitical risk across global energy markets. This event is not merely an isolated supply shock; it is the trigger for a cascading series of market dislocations. We are witnessing an immediate energy risk premium injection, which is forcing a violent sector rotation from growth-heavy tech (NQ) into defensive energy (XLE) and safe-haven assets (GLD).
The macro propagation is clear: energy-driven inflation expectations are compressing valuation multiples in rate-sensitive sectors, while liquidity fragmentation in energy futures (CL, NG) is creating a volatility-liquidity trap. Investors are currently navigating a "double-whammy" where energy-intensive manufacturing margins are being squeezed, and the Fed’s policy path is being complicated by the return of stagflationary pressures.
Layer 1: Direct Impacts — The Geopolitical Risk Premium
The immediate market reaction has been driven by the Khor Mor production suspension and the broader U.S. military directive to restrict Iranian land commerce via "Task Force Iron Gate."
- Energy Complex (CL, NG): WTI crude (CL=F) and Henry Hub natural gas (NG=F) have spiked as markets price in the potential for a blockade or significant disruption in the Strait of Hormuz. The supply disruption is not just about the loss of current barrels; it is about the uncertainty of transit, which forces a permanent risk premium into the term structure of energy futures.
- Gulf Equity Markets: Regional financial instability is triggering a retreat in Gulf equities (XLF, SPY), as the geopolitical risk premium forces a re-evaluation of regional investment sentiment.
- Safe-Haven Rotation: Capital is aggressively rotating into gold (GC, GLD) and the dollar (DXY) as the market seeks shelter from the volatility inherent in energy-linked assets.
Layer 2: Secondary Effects — Sector Rotation and Margin Squeeze
The direct energy shock has triggered a secondary wave of market adjustments, primarily centered on input cost volatility.
- Margin Compression: Energy-intensive sectors—specifically manufacturing (XLI) and logistics—are experiencing immediate margin compression. The sustained high energy price floor is not a transitory spike; it is becoming a structural cost of doing business, forcing firms to either absorb the costs or pass them on to consumers, further fueling inflation anxiety.
- Sector Rotation: We are observing a classic "risk-off" rotation. Capital is fleeing growth-heavy technology (XLK, NQ) as investors prioritize defensive energy (XLE) and safe-haven assets (GLD, XAU). The tech sector, which has been the primary driver of equity indices, is now facing a dual headwind: higher energy costs and a potential re-rating of valuation multiples.
- Industrial Commodity Hoarding: Supply chain disruption fears are driving "precautionary inventory hoarding" in industrial metals (HG, PL). This is creating a feedback loop where industrial firms are facing margin compression before the actual supply shock has fully materialized.
Layer 3: Macro Propagation — The Stagflationary Feedback Loop
The ripple effects of this energy-driven shock are now reaching the core of the macro environment.
- Valuation Multiplier Compression: The most significant macro impact is the compression of equity valuation multiples in rate-sensitive sectors. As energy-driven inflation expectations rise, the market is pricing in a more hawkish or "stagnant" Fed policy trajectory. This is hitting the Nasdaq (NQ) and Russell 2000 (RTY) harder than the S&P 500 (ES), as growth-oriented firms struggle to justify current valuations in a higher-cost environment.
- Liquidity Traps: The volatility in energy futures (CL, NG) has induced a liquidity trap. As hedging costs rise, market makers are widening spreads to compensate for the risk of sudden, large-scale moves. This liquidity drain forces speculative traders to reduce positions, which in turn increases volatility—a self-reinforcing loop that is now spilling over into broader index volatility (VXX).
- EM Currency Stress: The combination of a strong DXY and FII outflows from emerging markets (specifically India, NIFTY) is creating a "double-whammy" for currencies like the USDINR. This is not just dollar strength; it is a fundamental retreat of regional capital as investors prioritize safety over growth.
Layer 4: Non-Obvious Connections & Hidden Risks
The most dangerous risks are those hidden in the cross-asset connections.
- The Volatility-Liquidity Trap Loop: We are seeing a feedback loop between energy futures (CL, NG) and the broader volatility index (VXX). Geopolitical tension forces massive hedging in energy futures; this hedging activity creates liquidity traps; the resulting liquidity drain forces market makers to widen spreads; and this widened spread spikes VXX, which further discourages hedging and creates a volatility spiral.
- The Semiconductor-Energy Margin Squeeze: While XLE benefits from supply fears, the fab-heavy semiconductor supply chain (SMH, NVDA) is uniquely vulnerable. Semiconductors are highly energy-intensive. The hidden effect here is a rotation where XLE acts as a synthetic hedge for the supply-chain-exposed SMH. Investors are essentially funding their energy protection by selling their semiconductor exposure.
- Gold as a Proxy for Hormuz Risk: Historically, gold and oil are correlated via inflation expectations. Today, they are diverging. GC is acting as a pure-play hedge for Hormuz transit risk (L1), while CL is capped by the liquidity fragmentation mentioned above. This makes gold a "cleaner" geopolitical long than energy futures, which are currently plagued by liquidity traps.
Unified OCS Chart Read
Chart capture for NG, XLE, CL, NQ, and XLY is currently deferred to the asynchronous repair queue. Consequently, OCS Signal Engine and Delta evidence are unavailable for this report.
Technical Context (Based on Provided Data):
- ES=F (S&P 500 Futures): Trading at 7393.00, down significantly. RSI(14) at 34.02 suggests the index is approaching oversold territory, but the MACD remains deeply negative, indicating strong downward momentum.
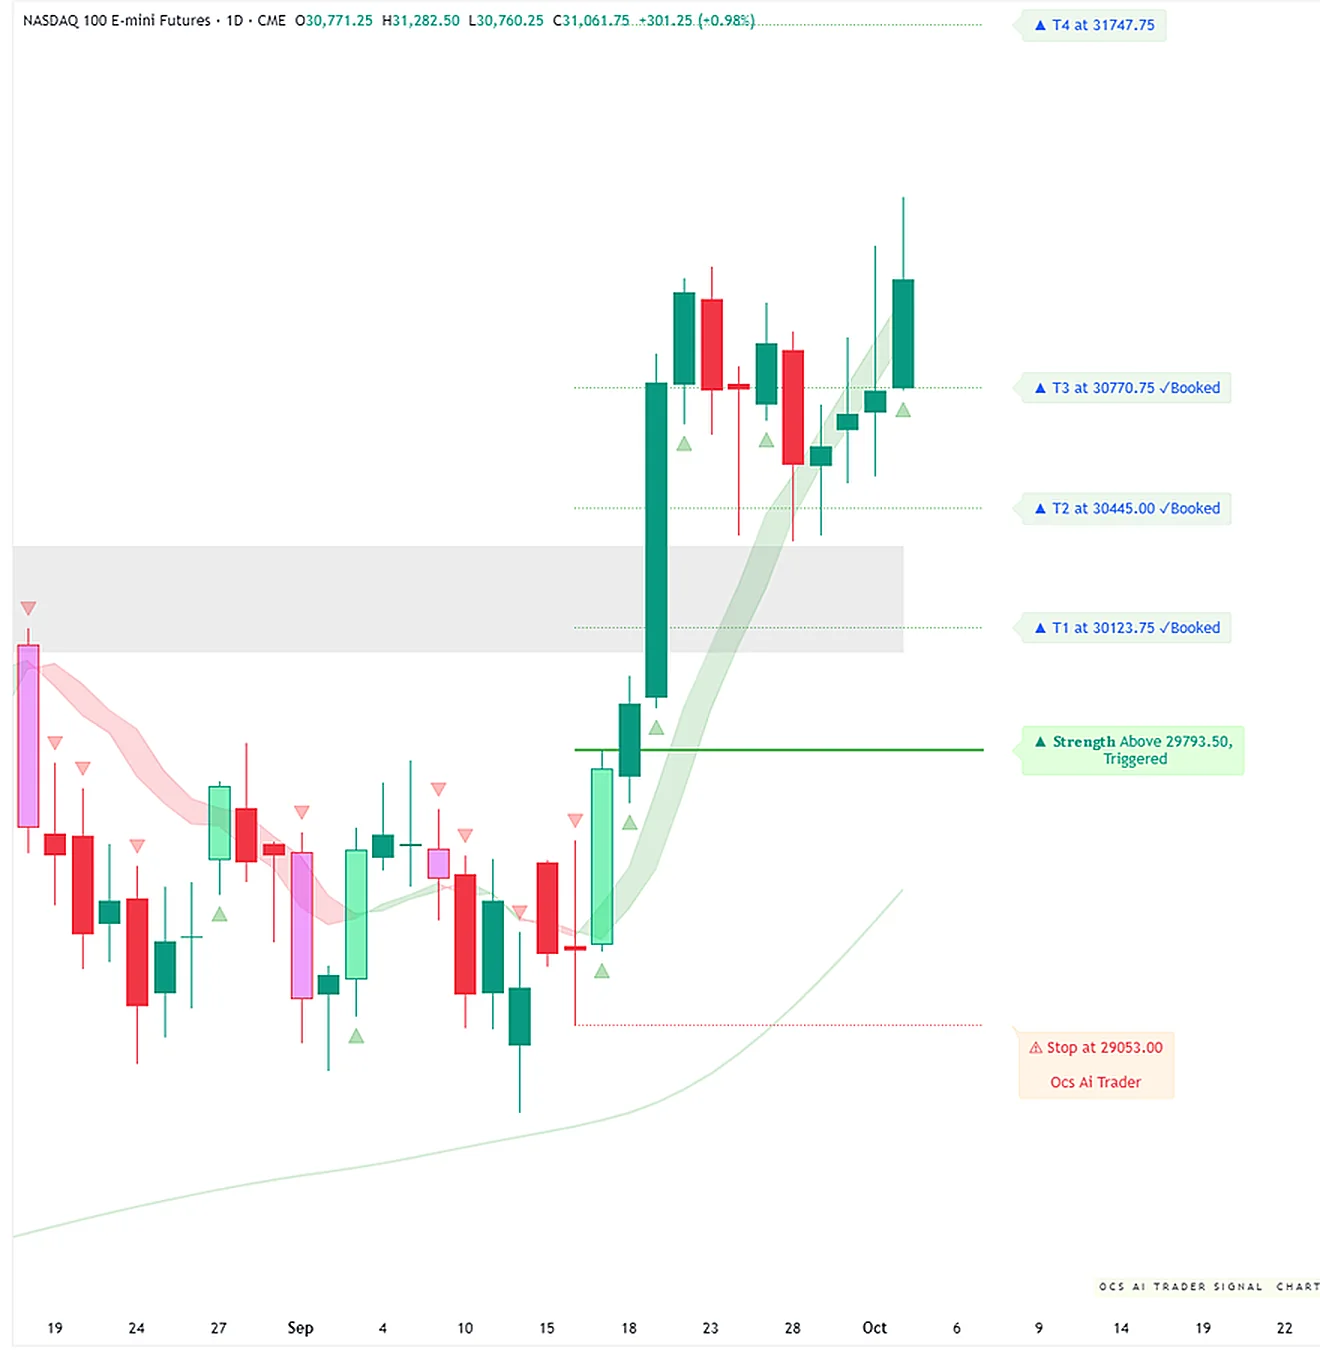
- NQ=F (Nasdaq Futures): Trading at 26937.25, with an RSI(14) of 29.92, indicating a deeply oversold condition. However, the lack of a clear support level in the recent price history suggests the market is still in price-discovery mode.
- CL=F (WTI Crude): Trading at 90.48, experiencing high volatility. The RSI(14) at 41.77 suggests the recent price surge may have room to run before hitting overbought levels, but the Bollinger Band width indicates high volatility.
- NG=F (Natural Gas): Trading at 3.01, with an RSI(14) of 53.98, showing a more balanced momentum profile compared to the equities.
Note: Without OCS liquidity and delta confirmation, these technical levels should be viewed as purely descriptive. Traders should exercise caution, as the current volatility environment renders standard technical indicators less reliable.
Security-by-Security Analysis
ES=F (S&P 500 Futures)
- Status: Bearish momentum, testing lower Bollinger Band support.
- Analysis: The index is struggling to find a floor as energy-driven inflation fears permeate the broad market. The 20-day SMA at 7673.48 acts as a major resistance level.
- Risk: Further breakdown if energy prices continue to surge, forcing a re-evaluation of the "soft landing" narrative.
NQ=F (Nasdaq Futures)
- Status: Deeply oversold, high volatility.
- Analysis: The Nasdaq is bearing the brunt of the valuation compression. With an RSI of 29.92, it is technically oversold, but the lack of institutional buying interest suggests the "valuation re-rating" is still in its early stages.
- Risk: Continued margin compression for tech firms could lead to further multiple contraction.
RTY=F (Russell 2000 Futures)
- Status: Weak, underperforming.
- Analysis: The Russell 2000 is sensitive to both higher borrowing costs and energy costs. The index is showing little resilience, reflecting the broader anxiety regarding small-cap profitability in a high-cost environment.
CL=F (WTI Crude)
- Status: Volatile, risk-premium driven.
- Analysis: The price is being driven by the Khor Mor suspension and Hormuz transit fears. The market is currently pricing in a "war premium."
- Risk: If diplomatic talks (mediated by Qatar) show progress, we could see a violent "gap-fill" reversal.
NG=F (Natural Gas)
- Status: Bullish, supply-constrained.
- Analysis: Natural gas is benefiting from the same supply disruption fears as crude. The market is currently testing the 3.00 level, which has acted as a psychological pivot.
Historical Parallels
The current environment bears a striking resemblance to the September 2019 Abqaiq-Khurais attack, which triggered a massive, albeit short-lived, spike in oil prices. However, the current situation is more complex due to the simultaneous presence of high inflation expectations and a fragile, post-midterm political environment in the U.S.
Unlike 2019, when the Fed was in a cutting cycle, the current Fed is operating under the constraint of persistent inflation. This limits their ability to provide the same level of liquidity support that the market enjoyed in 2019, making the current "liquidity trap" more dangerous.
Outlook & Risk Matrix
Short-Term (1-5 Days)
- Outlook: High volatility.
- Key Levels: Watch the 7300 level on ES=F and the 26500 level on NQ=F. If these fail, expect a further flush.
- Scenarios:
- Bullish: Diplomatic breakthrough in the Persian Gulf leads to a rapid unwinding of the energy risk premium.
- Bearish: Further escalation in the Strait of Hormuz, pushing WTI above 95.00 and triggering a capitulation in equities.
Medium-Term (1-4 Weeks)
- Outlook: Stagflationary, defensive.
- Key Levels: Monitor the 200-day SMA for the broader indices (though currently N/A in provided data, focus on the 50-day SMA).
- Scenarios:
- Base Case: Continued energy-driven inflation keeps the Fed hawkish, forcing a permanent re-rating of tech multiples.
- Bear Case: The "Volatility-Liquidity Trap Loop" breaks, leading to a broader financial market liquidity crisis.
What to Watch
- Strait of Hormuz Transit Reports: Any confirmation of tanker blockades will be the ultimate catalyst for the next leg up in energy prices.
- Fed Forward Guidance: Watch for any changes in language regarding "energy-driven inflation." If they shift from "transitory" to "structural," the equity market will likely repriced lower.
- FII Flows in India: This is a leading indicator for broader emerging market stress. If the outflows continue, expect the DXY to remain strong, further pressuring global risk assets.
- Energy Futures Open Interest: A spike in open interest alongside rising prices would confirm institutional hedging; a drop in open interest with rising prices would suggest a speculative blow-off top.
Education and market research only, not financial advice. Charts are OCS AI Trader readings at the time of writing and change with new bars.