The Stagflationary Trap: Energy Supply Shocks Meet Hawkish Fed Repricing
Executive summary
The global macro environment has shifted into a high-stakes "Stagflationary Trap." A dual-shock event—geopolitical supply-side disruption in the Persian Gulf and a hawkish repricing of Fed rate expectations following hot inflation data—has fundamentally altered the risk-reward calculus for global asset classes. We are witnessing a classic "double-whammy": energy-driven input cost inflation is compressing margins across industrials and consumer discretionary sectors, while simultaneously forcing a hawkish Fed to maintain restrictive policy, thereby elevating discount rates and crushing equity valuations. This report traces the cascading impact of these events from the Strait of Hormuz to the Nifty 50, identifying the non-obvious feedback loops that define the current market regime.
The Layered Impact Chain: From Geopolitics to Liquidity Drain
Layer 1: Direct Impacts (The Supply-Side Shock)
The immediate catalyst is a dual-front squeeze. First, heightened US-Iran tensions and new sanctions have introduced a severe geopolitical risk premium into the energy complex. Iraq's recent alignment with US-led transit corridors via Oman, while strategic, has failed to offset the immediate market fear of supply chain disruption in the Strait of Hormuz. Consequently, CL=F (WTI Crude) has surged by over 5%, reflecting a rapid bid in the futures term structure as traders scramble to hedge against potential transit blockages. Second, NG=F (Natural Gas) has experienced a parabolic move, up nearly 18%, driven by a confluence of cold weather forecasts and domestic production constraints. Simultaneously, the hot inflation print has forced an immediate, violent repricing of FOMC expectations, with markets now bracing for a 50bps hike in December.
Layer 2: Secondary Effects (Margin Compression & Rotation)
The immediate energy price surge is not merely a commodity story; it is a margin-destroying event for energy-intensive manufacturing and transport sectors. Companies in the XLI and XLY sectors are facing a dual-threat: input cost inflation is eroding operating margins, while the simultaneous rise in the discount rate (driven by the hawkish Fed) is forcing a re-rating of future earnings. This has triggered a defensive rotation. Capital is fleeing high-beta growth (NQ=F) and cyclical small-caps (RTY=F) in favor of defensive staples (XLP) and energy proxies (XLE). The financial sector (XLF) faces a more nuanced outlook: while higher rates theoretically benefit net interest margins, the looming threat of credit deterioration in energy-dependent industrial loan books is creating significant volatility.
Layer 3: Macro Propagation (The Stagflationary Feed)
The impact is now rippling through global capital flows. The strength of the DXY, driven by the hawkish Fed pivot, is acting as a global liquidity drain. Emerging markets are bearing the brunt. In India, the combination of a strengthening USD and the rising cost of energy imports (India’s current account vulnerability) is creating a "liquidity trap" for the NIFTY. Foreign institutional outflows are accelerating, not just due to global risk-off sentiment, but due to a structural reassessment of the RBI's ability to maintain liquidity without triggering further currency depreciation (USDINR). We are seeing a classic "flight-to-quality" into gold (GLD) and defensive volatility hedges, though the persistent hawkishness of the Fed creates a ceiling for gold, preventing it from acting as a pure inflation hedge.
Layer 4: Non-Obvious Connections (The Feedback Loops)
The most critical, yet overlooked, dynamic is the "Stagflationary Trap" feedback loop. The Fed is forced to maintain high rates to combat inflation, but these rates exacerbate the margin compression caused by the energy shock. This creates a self-reinforcing cycle: energy costs drive inflation → Fed keeps rates high → industrial margins collapse → equity valuations contract → capital flows into energy/staples → energy demand remains sticky → energy costs stay high.
Furthermore, we observe a "Semiconductor Onshoring" hedge. While risk-off sentiment usually crushes high-beta tech (SMH, NVDA), the strategic imperative of domestic chip production in a world of fractured supply chains (Hormuz risk) is creating a decoupling. The sector is no longer just a growth play; it is a national security asset. Finally, the "Volatility Arbitrage" in energy is exposed: the market is currently pricing volatility for equities (ES=F) but has significantly underpriced the volatility of energy inputs (NG=F). Any further escalation in the Middle East will trigger a non-linear spike in VXX, regardless of broader equity sentiment.
Unified OCS Chart Read
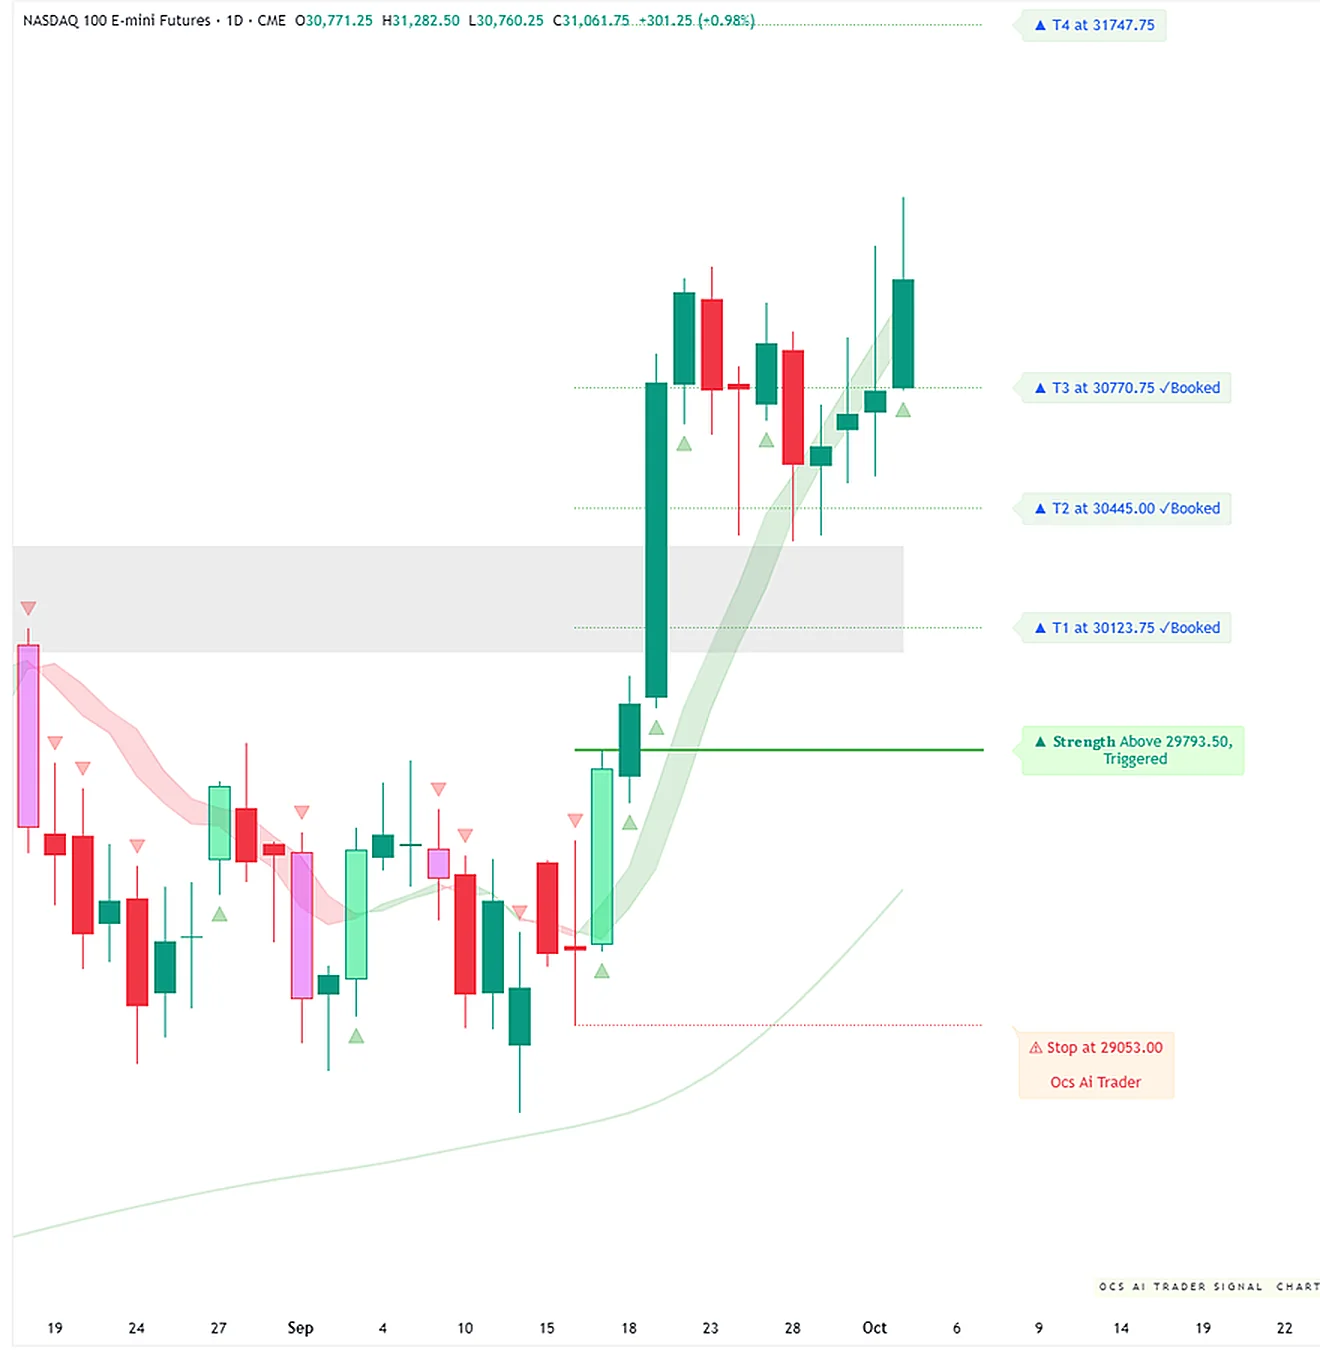
Note: OCS chart evidence is currently pending asynchronous enrichment. The following analysis reconciles the news thesis with the observed price action.
The price action across index futures (ES, NQ, RTY) confirms a distribution phase, with the breakdown in NQ=F (-6.03%) signaling a capitulation of the high-beta growth trade. The aggressive bid in CL=F and NG=F confirms that the market is currently prioritizing the "supply shock" narrative over the "soft landing" narrative.
- Setup Read: The market is in a "risk-off" regime. The correlation between equity indices and the DXY is deepening, suggesting a liquidity-driven sell-off rather than a fundamental earnings repricing.
- Levels to Watch:
- ES=F: The 7500 level is critical support. A sustained break below this would signal a shift to a lower structural range.
- CL=F: The $86.00 handle acts as a pivot. Holding above this confirms the geopolitical risk premium.
- NG=F: The current parabolic move is overextended; watch for a mean reversion if weather forecasts moderate.
- Confirmation/Contradiction: The price action confirms our "Stagflationary Trap" thesis. The contradiction lies in the financial sector (XLF), which is holding up better than the broader market, suggesting that the market is still pricing in the "higher-for-longer" rate benefit for banks, potentially ignoring the latent credit risk.
- Risk Notes: The lack of depth in the current volume (e.g., ES=F volume at 8,659) suggests that we are seeing a "thin-market" move, which can lead to exacerbated volatility during the upcoming session.
Security-by-Security Analysis
ES=F (S&P 500 Futures)
- Snapshot: Price $7556.75 (-2.83%).
- Analysis: The index is struggling to hold the 7500-7600 support zone. The MACD is deep in negative territory, confirming the bearish momentum. The "Stagflationary Trap" is front and center here: the index is trapped between the need for lower rates (to support valuation) and the reality of higher energy costs (which force the Fed to stay hawkish).
- Outlook: Bearish bias until we see a stabilization in the 2Y Treasury yield.
NQ=F (Nasdaq-100 Futures)
- Snapshot: Price $27944.25 (-6.03%).
- Analysis: The sharp drop reflects the high sensitivity of growth-oriented tech to rising discount rates. The "Semiconductor Onshoring" hedge is the only potential saving grace for components of this index, but the broader index is being liquidated to meet margin calls in other, more stressed asset classes.
- Outlook: High volatility. Watch for a test of the 27,000 psychological level.
RTY=F (Russell 2000 Futures)
- Snapshot: Price $2831.60 (-6.39%).
- Analysis: Small-caps are the canary in the coal mine for the "margin compression" thesis. Being more domestically focused and less cash-rich than mega-caps, they are the first to feel the impact of rising energy costs and tighter credit conditions.
- Outlook: Significant underperformance expected if the energy shock persists.
CL=F (WTI Crude)
- Snapshot: Price $86.29 (+5.07%).
- Analysis: The move is purely geopolitical. The open interest in the front-month contract is likely surging as shorts are forced to cover. The term structure is likely shifting toward backwardation, signaling acute near-term supply fears.
- Outlook: Highly sensitive to the next headline out of the Persian Gulf.
NG=F (Natural Gas)
- Snapshot: Price $3.29 (+17.86%).
- Analysis: The most violent move in the complex. This is a supply-demand squeeze. The cold weather forecast is the fundamental driver, but the technicals are now stretched.
- Outlook: Expect high mean reversion risk if the weather forecast shifts even slightly.
XLE (Energy Select Sector SPDR)
- Snapshot: Price $62.21 (+0.44%).
- Analysis: XLE is acting as the primary hedge for the market. It is the only sector benefiting from the core driver of the current volatility.
- Outlook: Bullish, but be wary of "sell-the-news" if the geopolitical tension plateaus.
XLF (Financial Select Sector SPDR)
- Snapshot: Price $58.29 (+0.52%).
- Analysis: XLF is currently a "strange bedfellow." It is rising on the expectation of higher rates, but the "Credit Deterioration Lag" (Layer 4) poses a massive medium-term risk.
- Outlook: Neutral. The short-term rate benefit is fighting the long-term credit risk.
Historical Parallels
The current environment bears a striking resemblance to the 1973-1974 oil embargo period. Like today, the market was faced with a supply-side shock (oil) hitting an economy already struggling with inflationary pressure. In 1973, the resulting "stagflation" led to a prolonged period of equity market stagnation and a violent rotation into commodities and gold. The key difference today is the speed of information and the algorithmic nature of the market, which leads to much faster, more violent "liquidity events" compared to the 70s.
Outlook & Risk Matrix
| Horizon | Scenario | Key Drivers |
|---|---|---|
| Short-Term (1-5 days) | High Volatility / Bearish | Further escalation in Iran/Iraq headlines; Fed speaker hawkishness. |
| Medium-Term (1-4 weeks) | Stagflationary Consolidation | Earnings downgrades start to hit the tape; Energy prices remain elevated. |
Bullish Case: A sudden diplomatic breakthrough in the Persian Gulf leads to a rapid de-escalation of the risk premium, allowing the Fed to pause and equities to re-rate. Bearish Case (Base): The "Stagflationary Trap" holds. Energy prices stay high, the Fed stays hawkish, and equity valuations continue to contract as earnings estimates are revised downward.
What to Watch
- Strait of Hormuz Transit Data: Any reports of tanker disruption will trigger an immediate, non-linear spike in CL=F and NG=F.
- US 2Y/10Y Yield Curve: A deepening inversion or a violent steepening will provide the clearest signal on the market's expectation of the Fed's "policy error" risk.
- Earnings Revisions (XLI/XLY): Keep a close eye on guidance from transport and industrial firms; if they start citing "energy input costs" as a primary margin headwind, the "Stagflationary Trap" is fully confirmed.
- USDINR/NIFTY Correlation: If the NIFTY continues to sell off despite a potential pause in global indices, it confirms the "Liquidity Drain" thesis and signals deeper stress in the EM corridor.
Education and market research only, not financial advice. Charts are OCS AI Trader readings at the time of writing and change with new bars.