The Geopolitical Risk Reset: Energy De-escalation Meets Tech Capitulation
The global macro environment has shifted on a dime this Friday, November 6, 2026. We are witnessing a rare confluence of two distinct, high-impact forces: a fundamental decompression of geopolitical risk premiums in the energy sector, and a technical, liquidity-driven capitulation in the US equity markets.
The news of Iran’s nuclear proposal submitted via Qatari mediators has acted as a catalyst for a massive unwinding of the "war premium" that has kept energy prices elevated for months. Simultaneously, the Nasdaq’s slide into technical correction territory has triggered a classic retail capitulation, forcing a liquidity-draining deleveraging cycle that is rippling across NQ=F, ES=F, and the broader high-beta complex.
This environment is not merely about "risk-on" or "risk-off." It is a structural bifurcation. We are seeing a rotation out of defensive safe-havens (GLD) and geopolitical hedges (CL=F, NG=F) into a market that is simultaneously trying to find a floor in growth equities (NQ=F) amid a tightening liquidity environment.
The Cascading Impact Chain: A Layered Analysis
To navigate this, we must trace the impact through our four-layer framework.
Layer 1: Direct Impacts
The most immediate effect of the Iranian diplomatic overture is the collapse of the geopolitical risk premium. Assets like CL=F, BRENT, and XLE are facing immediate downward pressure as the "Hormuz risk" is repriced. Conversely, the Nasdaq’s technical breakdown has triggered a violent, liquidity-draining retail exit. This is not a fundamental revaluation of tech earnings but a mechanical, stop-loss-driven liquidation that is forcing margin calls across the board.
Layer 2: Secondary Effects
The compression of energy producer margins is the primary secondary effect. As energy prices (CL=F) retreat, the "war premium" evaporates, forcing energy majors (XLE) to adjust their forward guidance. However, there is a counter-balance: cost-push deflationary relief for energy-intensive sectors. Industrials (XLI) and transport-heavy components of the ES=F index are seeing a reduction in operating expenses, which may eventually provide a valuation floor if the broader market stabilizes.
Layer 3: Macro Propagation
The macro ripple is twofold. First, the reduction in Middle East tail risk is causing a rotation out of non-yielding safe-havens like gold (GLD). Second, the "higher-for-longer" interest rate narrative is being reinforced by a resilient US economy, as evidenced by recent PMI data, which keeps the DXY elevated. This creates a "yield trap" for emerging markets (USDINR), where the benefit of lower oil import costs is being offset by the strength of the dollar and the resulting capital flight.
Layer 4: Non-Obvious Cross-Connections
The most critical non-obvious connection is the "Transition Trap." The sudden reduction in geopolitical risk for oil/gas is dampening the urgency for LNG infrastructure build-outs. This, in turn, suppresses long-term NG prices and impacts the capital expenditure cycle for green-tech and semiconductor firms (SMH) that rely on high energy prices to justify their ROI. Furthermore, we are seeing a "Safe-Haven Correlation Break": typically, gold and the dollar are inversely related. Today, we are seeing a simultaneous exit from gold (due to risk-premium unwinding) and a potential stabilization of the DXY (due to monetary policy divergence), breaking the traditional hedge correlation.
Security-by-Security Analysis
ES=F (S&P 500 Futures)
Fig. 1 ES=F — Signals + Liquidity · open full sizeFig. 2 ES=F — Delta + Technical · open full sizeES=F — Unified OCS chart read
Executive Summary
The consensus direction is bearish, characterized by a pre-trigger state for a structural breakdown. While Chart 1 — Signals + Liquidity identifies a 'Weakness Below' declaration with a primary trigger at 7375.25, Chart 2 — Delta + Technical confirms active selling pressure through net-negative CVD and price sitting within a negative liquidity band. The strongest confluence is the alignment between the bearish momentum/cycle regime (Chart 1) and the negative Delta Force/CVD pressure (Chart 2).
OCS Confluence
Grade
Directional Bias
Participation State
medium
bearish
pre-trigger
Setup Read: The market is currently exhibiting a bearish structural setup in a pre-trigger state, supported by negative delta and liquidity regimes despite the price remaining above the primary breakdown trigger.
Confirmations
Both charts identify a bearish regime (Pink momentum band in Chart 1; Negative cycle/liquidity band in Chart 2).
Price is operating below key structural ceilings (Pink momentum band in Chart 1; Negative liquidity lines in Chart 2).
Aggressive selling force is present (Weakness declaration in Chart 1; Red CVD/Delta arrows in Chart 2).
Contradictions
Chart 1 notes the setup is currently 'conflicting' as the price remains significantly above the 7375.25 trigger, whereas Chart 2 shows active net selling pressure currently influencing price action.
Levels To Watch
7746.25 (Stop/Invalidation - Chart 1)
7572.00 (Immediate Resistance/EMA 9 - Chart 2)
7375.25 (Downside Trigger - Chart 1)
7500.00-7600.00 (Open Space/Gray Zone - Chart 1)
7700.00 (Current Price Context - Chart 1)
Invalidation
Structural failure occurs upon a price breach of the 7746.25 level.
Risk Notes
Hands-off risk noted due to tangled cycle behavior within the negative liquidity band (Chart 2).
RSI at 50.50 suggests a lack of immediate oversold conditions, allowing for potential consolidation (Chart 2).
Significant distance between current price and the 7375.25 trigger implies a long-term breakdown requirement (Chart 1).
ES=F — Signals + Liquidity (click to expand)
Visible Context
Symbol
Timeframe
Layout Confidence
ES1! S&P 500 E-mini Futures
D
high
Signal Engine
Direction
Declaration
Trigger
Trigger Status
Stop / Invalidation
SHORT
Weakness Below
7375.25
Triggered
7746.25
Target Ladder
T1
T2
T3
T4
T5
Booked
Next Unbooked
N/A
N/A
N/A
N/A
N/A
None
N/A
Structure Context
Float-Volume Zones
Momentum Band
Dominant Cycle
Price Location
Structural Context
Price is currently rejecting the pink extreme float-volume zone near 7746.25 and is in open space below the gray zone at 7500-7600.
weakness with price trading within the pink momentum band.
bearish with a pink ribbon showing active negative cycle pressure.
Price is currently at 7700.00, below the trigger of 7375.25, and above the stop of 7746.25.
The setup is conflicting as the trigger of 7375.25 is currently below the current market price, suggesting a breakdown from higher levels toward the trigger.
Setup Read
State
R:R to T1
R:R to Furthest
Invalidation
Evidence Quality
Notes
pre-trigger
N/A
N/A
Price breaching 7746.25.
medium
The structure shows a Weakness Below declaration with a trigger at 7375.25, but current price action remains above that level within a pink momentum/cycle regime.
ES=F — Delta + Technical (click to expand)
OCS Layout Presence
Delta Configuration Badge
Delta Histogram / CVD
Liquidity Overlay / Cycle
Ocs Ai Trader | Delta Configuration badge visible at the bottom of the price pane.
Green and red CVD columns visible in the bottom panel, with green arrows above and red arrows below the histogram.
Pink/purple liquidity bands visible on the price chart; stepped liquidity lines visible.
Liquidity Engine
Active Band
Vs Slow Liquidity
Vs Fast Liquidity
Cycle State
Divergence
Hands-Off Risk
negative liquidity band, with latest price situated within the shaded pink area.
below slow negative liquidity line.
below fast negative liquidity line.
tangled/overlapping within the negative band.
none
medium due to price sitting in a negative liquidity band with tangled cycle behavior.
Delta Engine
CVD Pressure
Dominant Cycle Leader
Adaptive Filter
Delta Force
Exhaustion Boundary
net selling (predominantly red columns in recent bars).
negative
bearish ceiling
recent red delta-force arrows visible below the CVD.
none
Secondary TA
EMA
RSI
MACD
EMA 9 (7,572.18) and EMA 21 (7,557.94) visible.
RSI 14 (50.50) visible.
MACD 12 26 9 (-38.31, -68.62, -30.31) visible.
Confluence
Setup Type
Directional Bias
Conviction
Confirmation
Contradiction
Key Level
trend-continuation short
bearish
medium
Price is below both fast and slow negative liquidity lines, operating within a negative liquidity band with net selling CVD pressure.
RSI is near neutral (50.50), suggesting a lack of immediate oversold conditions.
7,572 (EMA 9/Immediate resistance)
The ES=F is caught in the crossfire of the tech sell-off and the energy-driven rotation. The index is testing the lower bounds of its recent range. The technical breakdown of the Nasdaq is acting as a contagion vector, forcing index-wide selling.
* **Market Snapshot:** Price: $7343.50 (-5.24%).
* **Setup:** The index is currently in a liquidity-draining mode. The primary risk is a further breakdown below the $7300 level, which would trigger additional algorithmic selling. Watch the basis between ES=F and RTY=F; if small-caps (RTY) show relative strength, it could signal a rotation into cyclicals, but currently, the entire complex is under pressure.
NQ=F (Nasdaq-100 Futures)
The Nasdaq is the epicenter of the current liquidity trap. The technical correction has moved from a "dip buying" opportunity to a "liquidity-draining" event.
Dynamics: The recursive feedback loop between crypto-proxies and tech-heavy indices is in full swing. Margin calls are forcing the sale of high-beta tech, which in turn triggers further margin calls.
Outlook: Until the volatility premium (UVXY) stabilizes, the NQ=F is likely to remain under pressure. The focus should be on whether institutional buyers step in at the 200-day SMA or if the "retail capitulation" continues to drive prices lower.
RTY=F (Russell 2000 Futures)
The RTY=F is seeing the most significant volatility. Small-caps are highly sensitive to energy input costs, so the "deflationary relief" from lower oil prices (CL=F) should theoretically be a tailwind. However, the current liquidity drain is indiscriminate, and small-caps are often the first to be sold during a deleveraging cycle.
Dynamics: If the market stabilizes, the RTY=F may be the first to rebound due to the margin expansion narrative (Layer 3).
Market Snapshot: Price: $2720.60 (-10.07%).
CL=F (WTI Crude) & NG=F (Natural Gas)
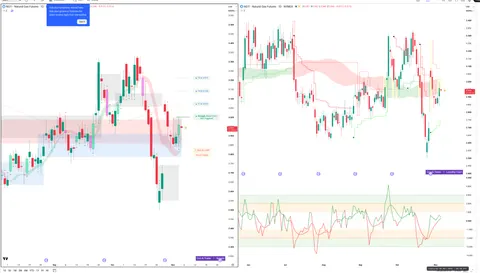
Fig. 3 NG=F — Signals + Liquidity · open full sizeFig. 4 NG=F — Delta + Technical · open full sizeNG=F — Unified OCS chart read
Executive Summary
The consensus outlook for NG=F is bearish structural weakness, though immediate participation is stalled by conflicting micro-data. While Chart 1 — Signals + Liquidity identifies a high-quality short setup pending a breach of 2.944, Chart 2 — Delta + Technical indicates a 'hands-off' state due to tangled cycles, mixed CVD pressure, and price sitting within an uncertain liquidity transition zone.
OCS Confluence
Grade
Directional Bias
Participation State
low
bearish
pre-trigger
Setup Read: A bearish structural setup is pending a trigger at 2.944, though immediate delta and liquidity cycles remain tangled and inconclusive.
Confirmations
Price is currently rejecting a red extreme float-volume zone (Chart 1) while navigating a transition zone near the edge of the shaded liquidity band (Chart 2).
Bearish momentum alignment in Chart 1 is mirrored by the neutral-to-weak RSI of 49.58 in Chart 2.
Contradictions
Chart 1 identifies a 'high' evidence quality bearish setup, whereas Chart 2 classifies the current state as 'hands-off' due to tangled cycles and mixed delta force.
Chart 1 sees clear weakness/bearish ribbon pressure, while Chart 2 shows recent CVD bars transitioning toward small buying accumulation.
Structural failure occurs upon a breach of the catastrophic stop at 2.839 (Chart 1).
Risk Notes
High risk of chop/uncertainty due to price being in a liquidity transition zone (Chart 2).
Tangled cycle lines and mixed delta markers suggest lack of directional conviction in the immediate term (Chart 2).
NG=F — Signals + Liquidity (click to expand)
Visible Context
Symbol
Timeframe
Layout Confidence
NG1! Natural Gas Futures - 1D
1D
high
Signal Engine
Direction
Declaration
Trigger
Trigger Status
Stop / Invalidation
SHORT
Weakness Below
2.944
Not Triggered
2.839
Target Ladder
T1
T2
T3
T4
T5
Booked
Next Unbooked
2.750
2.650
2.550
2.450
N/A
None
2.750
Structure Context
Float-Volume Zones
Momentum Band
Dominant Cycle
Price Location
Structural Context
Latest price is rejecting a red extreme float-volume zone at 2.944.
weakness with price currently within the pink weakness band.
bearish with pink ribbon pressure visible below current price levels.
Price is currently at the trigger level (2.944) inside a red extreme zone, below the green strength band and pink weakness band, positioned between the trigger and the stop at 2.839.
The setup is clean as price is rejecting a red extreme float-volume zone while aligned with the pink weakness band and pink cycle ribbon.
Setup Read
State
R:R to T1
R:R to Furthest
Invalidation
Evidence Quality
Notes
pre-trigger
N/A
N/A
Price breach of the catastrophic stop at 2.839.
high
The decline is supported by alignment between momentum bands, cycle ribbons, and a recent rejection of an extreme float-volume zone.
NG=F — Delta + Technical (click to expand)
OCS Layout Presence
Delta Configuration Badge
Delta Histogram / CVD
Liquidity Overlay / Cycle
Ocs Ai Trader | Delta Configuration
Visible CVD columns in the bottom panel, featuring green bars indicating net buying and red bars indicating net selling, along with small green/red triangle force markers at the very bottom.
Visible liquidity band shaded in light purple/blue behind the price action in the main chart, with a stepped/line structure visible.
Liquidity Engine
Active Band
Vs Slow Liquidity
Vs Fast Liquidity
Cycle State
Divergence
Hands-Off Risk
uncertain, price is currently within a transition zone near the edge of the shaded band
below slow positive line
at fast negative line
tangle
none
high, price is in a transition/uncertain liquidity band with tangled cycle lines
Delta Engine
CVD Pressure
Dominant Cycle Leader
Adaptive Filter
Delta Force
Exhaustion Boundary
mixed, recent bars show a transition from selling to small buying accumulation
tangled
mixed
mixed, recent markers show both green and red triangles
none
Secondary TA
EMA
RSI
MACD
EMA 21 close: 2.925
RSI 14 close: 49.58
MACD 12 26 9: 0.008 -0.026 -0.033
Confluence
Setup Type
Directional Bias
Conviction
Confirmation
Contradiction
Key Level
hands-off
neutral
low
N/A
Uncertain liquidity band is active and dominant delta cycles are tangled.
2.925
Fig. 5 CL=F — Signals + Liquidity · open full sizeFig. 6 CL=F — Delta + Technical · open full sizeCL=F — Unified OCS chart read
Executive Summary
The current outlook for CL=F is neutral as the market enters a regime transition. While Chart 1 — Signals + Liquidity notes a prior SHORT declaration triggered at 98.14, recent price action has retraced above both the trigger and the first booked target (90.75), creating a conflicting structural setup. This lack of directional clarity is confirmed by Chart 2 — Delta + Technical, which shows tangled delta cycles near the zero line and price exiting a bullish liquidity band into an uncertain transition zone near $94.00.
OCS Confluence
Grade
Directional Bias
Participation State
hands-off
neutral
unclear
Setup Read: CL=F is exhibiting neutral structural characteristics as price retraces through prior trigger levels amidst tangled delta cycles and transitioning liquidity bands.
Confirmations
Both charts indicate a regime transition/tangle (Chart 1: momentum ribbon flattening; Chart 2: liquidity lines converging).
Price is currently navigating between established structural zones rather than trending (Chart 1: open space; Chart 2: uncertain liquidity band).
Contradictions
Chart 1 maintains a 'Weakness Below' short declaration, whereas Chart 2's delta/CVD profile is currently mixed/neutral.
Structural failure of the short thesis occurs if price sustains above the 98.14 trigger level [Chart 1 — Signals + Liquidity].
Risk Notes
Chop risk due to tangled delta cycles near zero [Chart 2 — Delta + Technical].
Uncertain liquidity band active near $94.00 [Chart 2 — Delta + Technical].
Conflicting setup following price retracement above initial trigger and target [Chart 1 — Signals + Liquidity].
CL=F — Signals + Liquidity (click to expand)
Visible Context
Symbol
Timeframe
Layout Confidence
CL1: Light Crude Oil Futures
1D
high
Signal Engine
Direction
Declaration
Trigger
Trigger Status
Stop / Invalidation
SHORT
Weakness Below
98.14
Triggered
N/A
Target Ladder
T1
T2
T3
T4
T5
Booked
Next Unbooked
90.75 (Booked)
86.46
82.13
N/A
N/A
90.75
86.46
Structure Context
Float-Volume Zones
Momentum Band
Dominant Cycle
Price Location
Structural Context
Price is currently in open space, above the pink extreme float-volume zone (approx 92-96) and the gray average volume zone (approx 88-92).
mixed; price is currently trading above the pink weakness band but within the green strength band area, suggesting a regime transition.
transition; the ribbon is flattening/stabilizing between a prior negative cycle and current price action.
Price (93.00) is above the trigger (98.14) and the first booked target (90.75), moving back toward the trigger level.
The setup is conflicting as price has retraced above the trigger and first target after the initial downside move.
Setup Read
State
R:R to T1
R:R to Furthest
Invalidation
Evidence Quality
Notes
unclear
N/A
N/A
Price sustaining above the trigger level of 98.14.
high
Downside declaration was triggered at 98.14, but recent price action has retraced above the first booked target of 90.75.
CL=F — Delta + Technical (click to expand)
OCS Layout Presence
Delta Configuration Badge
Delta Histogram / CVD
Liquidity Overlay / Cycle
Visible text 'Ocs Ai Trader | Delta Configuration' located above the CVD panel.
Visible green and red CVD/Delta columns at the bottom, with small green/red triangles below the histogram representing force/cycle markers.
Visible shaded liquidity bands (green/pink) overlaid on the price candles and stepped liquidity lines.
Liquidity Engine
Active Band
Vs Slow Liquidity
Vs Fast Liquidity
Cycle State
Divergence
Hands-Off Risk
uncertain; price is currently exiting a green bullish band into a transition area near the $94 level.
below slow negative liquidity line (the upper pink ceiling).
below fast negative liquidity line.
tangle; fast and slow liquidity lines are converging/crossing near current price.
none
medium; uncertain liquidity band active with price testing the transition between bullish and bearish zones.
Delta Engine
CVD Pressure
Dominant Cycle Leader
Adaptive Filter
Delta Force
Exhaustion Boundary
mixed; recent columns show alternating green and red with a recent lean towards red/flattening.
tangled; cycles are oscillating near the zero line.
mixed
mixed; recent triangles show a mix of green and red markers.
none
Secondary TA
EMA
RSI
MACD
EMA 9 (blue) and EMA 21 (orange) are visible; price is currently between them.
RSI 14 close is visible at 42.78.
MACD 12 26 9 is visible with lines crossing near the zero line.
Confluence
Setup Type
Directional Bias
Conviction
Confirmation
Contradiction
Key Level
hands-off
neutral
low
N/A
Uncertain liquidity band is active and delta cycles are tangled near the zero line.
$94.00
The energy complex is in a state of repricing. The diplomatic thaw between the US and Iran via Qatar is the primary driver.
* **CL=F:** The term structure is likely flattening as the geopolitical risk premium is removed. We are seeing a rapid unwinding of long positions.
* **NG=F:** Natural gas is showing a surprising resilience (+9.71%), likely due to the "Transition Trap" narrative where long-term supply concerns are being re-evaluated in light of the reduced geopolitical risk for global LNG flows.
* **Levels:** Watch for the $90 support level on CL=F; a break below this would confirm a shift in the structural floor of the market.
XLE (Energy Select Sector SPDR)
Fig. 7 XLE — Signals + Liquidity · open full sizeFig. 8 XLE — Delta + Technical · open full sizeXLE — Unified OCS chart read
Executive Summary
The current XLE structure is in a state of post-signal exhaustion following the completion of the primary 'Strength Above' sequence (Chart 1 — Signals + Liquidity). While Chart 1 maintains a bullish structural context via the green ribbon, Chart 2 — Delta + Technical indicates a significant shift into a negative liquidity band with tangled cycles and mixed CVD pressure. The confluence suggests a transition from a trend-following regime into a high-uncertainty, low-conviction retracement phase.
OCS Confluence
Grade
Directional Bias
Participation State
hands-off
neutral
exhausted
Setup Read: XLE is currently navigating a post-trend retracement, characterized by completed primary targets and a shift into a negative liquidity regime with mixed delta force.
Confirmations
Both charts indicate price is currently retracing from historical highs/targets.
Price location (64.63) sits within the intersection of the lower target zones (Chart 1) and the negative liquidity band (Chart 2).
Contradictions
Chart 1 maintains a bullish structural context (green ribbon support), whereas Chart 2 reports a bearish directional bias due to negative liquidity and tangled cycles.
Chart 1 shows price in 'open space' above float-volume, while Chart 2 shows price trapped inside a negative liquidity band.
Levels To Watch
67.33 (Original Trigger - Chart 1)
65.14 (Stop / Invalidation - Chart 1)
64.57 (EMA 21 - Chart 2)
64.00-62.00 (Float-Volume Zone - Chart 1)
62.18 (Unbooked T4 Target - Chart 1)
Invalidation
Structural failure is defined by a breach of the 65.14 stop level (Chart 1).
Risk Notes
High uncertainty due to tangled dominant cycles and mixed CVD/delta-force markers (Chart 2).
Exhausted state following the booking of T1-T3 targets (Chart 1).
Price is currently trading below both fast and slow negative liquidity lines (Chart 2).
XLE — Signals + Liquidity (click to expand)
Visible Context
Symbol
Timeframe
Layout Confidence
XLE
1D
high
Signal Engine
Direction
Declaration
Trigger
Trigger Status
Stop / Invalidation
LONG
Strength Above
67.33
Triggered
65.14
Target Ladder
T1
T2
T3
T4
T5
Booked
Next Unbooked
66.57
65.54
64.78
62.18
60.64
T1, T2, T3
T4
Structure Context
Float-Volume Zones
Momentum Band
Dominant Cycle
Price Location
Structural Context
Price is in open space above the recent pink/red extreme float-volume zone near 62.00-64.00.
strength; price is trading within the green strength band.
bullish; the green ribbon is providing active positive cycle support below price.
Price is currently at 64.63, which is below the original trigger of 67.33 and all booked targets, but above the T4 and T5 targets.
The setup shows historical strength with multiple targets booked, though current price action is retracing toward the lower target levels.
Setup Read
State
R:R to T1
R:R to Furthest
Invalidation
Evidence Quality
Notes
exhausted
N/A
N/A
Price breaching the 65.14 stop level.
high
The initial Strength Above declaration has completed its primary target sequence (T1-T3), with current price action testing lower unbooked targets within the strength regime.
XLE — Delta + Technical (click to expand)
OCS Layout Presence
Delta Configuration Badge
Delta Histogram / CVD
Liquidity Overlay / Cycle
Ocs Ai Trader | Delta Configuration is visible at the top of the delta/cycle panel.
Visible pink/red and light green CVD columns at the bottom, with small green delta-force arrows appearing periodically.
Visible liquidity bands (green/positive and pink/negative) and cycle lines on the main price chart.
Liquidity Engine
Active Band
Vs Slow Liquidity
Vs Fast Liquidity
Cycle State
Divergence
Hands-Off Risk
negative, with price currently trading inside the pink liquidity band.
below slow negative liquidity line
below fast negative liquidity line
tangle
none
high, due to price being in a negative liquidity band with tangled cycles and conflicting delta signals.
Delta Engine
CVD Pressure
Dominant Cycle Leader
Adaptive Filter
Delta Force
Exhaustion Boundary
mixed
tangled
mixed
mixed, recent green and red arrows are present.
none
Secondary TA
EMA
RSI
MACD
EMA 21 close: 64.57, EMA 9 close: 64.01
RSI 14 close: 34.01
MACD close 12 26 9: -0.0014 0.1608 0.9621
Confluence
Setup Type
Directional Bias
Conviction
Confirmation
Contradiction
Key Level
hands-off
bearish
low
Price is trading within a negative liquidity band and below both fast and slow negative liquidity lines.
Tangled dominant cycles and mixed CVD/delta-force markers indicate high uncertainty in the current move.
64.57 (EMA 21)
XLE is the direct beneficiary of the previous "war premium" and is now the direct victim of its removal.
* **Dynamics:** The options chain shows significant put activity at the $61.50 and $62.00 strikes, suggesting that the market is positioning for further downside or hedging against a deeper correction.
* **Outlook:** The sector is undergoing a necessary re-rating. Investors should monitor whether the dividend yield becomes attractive enough to provide a floor, or if the margin compression narrative dominates.
GLD (Gold)
Fig. 9 GLD — Signals + Liquidity · open full sizeFig. 10 GLD — Delta + Technical · open full sizeGLD — Unified OCS chart read
Executive Summary
The consensus outlook for GLD is bearish, centered on a high-conviction structural rejection of an upper extreme float-volume zone (Chart 1). While the Signal Engine identifies a pending short trigger at 375.49, current participation is in a pre-trigger state as liquidity and delta forces show mixed signals (Chart 2). The strongest confluence is the alignment between the pink weakness band in Chart 1 and the negative liquidity bands reported in Chart 2.
OCS Confluence
Grade
Directional Bias
Participation State
medium
bearish
pre-trigger
Setup Read: GLD is observing a bearish structural setup as price tests a primary trigger level following rejection from an extreme float-volume zone.
Confirmations
Both charts identify price action within bearish/negative shaded zones (Chart 1 pink weakness band; Chart 2 negative liquidity band).
Price is currently trading below both fast and slow negative liquidity lines (Chart 2) while rejecting upper float-volume boundaries (Chart 1).
Structural momentum is aligned toward the downside (Chart 1 bearish cycle; Chart 2 net selling accumulation in CVD).
Contradictions
Chart 1 shows high evidence quality for a bearish setup, whereas Chart 2 notes low conviction due to neutral RSI/MACD readings.
Delta Engine (Chart 2) shows mixed delta-force arrows, contrasting with the clean structural rejection noted in Chart 1.
Structural failure occurs if price breaches 378.66 (Chart 1).
Risk Notes
Medium hands-off risk due to mixed delta force markers and neutral momentum oscillators (Chart 2).
Potential for chop as RSI and MACD are currently near neutral levels (Chart 2).
Trigger has not yet been activated, leaving the setup in a pre-participation phase (Chart 1).
GLD — Signals + Liquidity (click to expand)
Visible Context
Symbol
Timeframe
Layout Confidence
GLD
1D
high
Signal Engine
Direction
Declaration
Trigger
Trigger Status
Stop / Invalidation
SHORT
Weakness Below
375.49
Not Triggered
378.66
Target Ladder
T1
T2
T3
T4
T5
Booked
Next Unbooked
369.86
363.86
361.46
N/A
N/A
None
369.86
Structure Context
Float-Volume Zones
Momentum Band
Dominant Cycle
Price Location
Structural Context
Price is currently within a pink extreme float-volume zone (approx 375-390) and rejecting the upper boundary.
weakness with price trading within the pink weakness band at the bottom of the recent range.
bearish with the pink ribbon showing active negative cycle pressure.
Price is currently at 375.49, which is the designated trigger level, sitting just below a pink extreme float-volume zone and above the T1 target of 369.86.
The setup is clean as price is rejecting an extreme pink float-volume zone and the trigger is resting at the current level.
Setup Read
State
R:R to T1
R:R to Furthest
Invalidation
Evidence Quality
Notes
pre-trigger
3.01
N/A
378.66
high
Price is testing the trigger level of 375.49 following rejection from the pink extreme float-volume zone.
GLD — Delta + Technical (click to expand)
OCS Layout Presence
Delta Configuration Badge
Delta Histogram / CVD
Liquidity Overlay / Cycle
Ocs Ai Trader | Delta Configuration badge is visible at the bottom of the main price panel.
Visible CVD columns at the bottom of the chart, showing recent red columns and some green columns. Small green and red delta-force arrows are visible near the bottom of the CVD panel.
N/A
Liquidity Engine
Active Band
Vs Slow Liquidity
Vs Fast Liquidity
Cycle State
Divergence
Hands-Off Risk
negative, with recent price action occurring within a red-shaded bearish zone.
below slow negative liquidity line
below fast negative liquidity line
N/A
none
medium, price is in a negative liquidity band with mixed delta force markers.
Delta Engine
CVD Pressure
Dominant Cycle Leader
Adaptive Filter
Delta Force
Exhaustion Boundary
mixed, showing recent net selling accumulation (red columns) following a period of net buying.
N/A
N/A
mixed recent green and red delta-force arrows
none
Secondary TA
EMA
RSI
MACD
EMA 9: 368.97, EMA 21: 373.11
RSI 14: 50.17
MACD close: 0.6362
Confluence
Setup Type
Directional Bias
Conviction
Confirmation
Contradiction
Key Level
unclear
bearish
low
Price is trading below both fast and slow negative liquidity lines within a negative liquidity band.
Recent RSI and MACD readings are near neutral levels, suggesting a lack of immediate momentum.
373.11
Gold is currently suffering from a "correlation break." Usually, a risk-off event would drive gold higher. However, because the risk-off event (the Iran-US proposal) is *also* the reason for the risk-premium unwinding, gold is being sold as a hedge that is no longer needed.
* **Dynamics:** The unwinding of the Iran-Hormuz risk premium is the dominant driver.
* **Outlook:** Watch the $375 level. If it holds, it may indicate that the "safe-haven" status is being re-established, but for now, the momentum is clearly to the downside.
Unified OCS Chart Read
XLE, GLD, BRENT, CL=F, DXY: Chart evidence is unavailable at this time. We are operating in a data-thin environment regarding visual technicals. We caution against relying on purely technical setups without the confirmation of OCS delta and liquidity flows. The current market is driven by macro-narrative shifts, making traditional technical analysis susceptible to "whipsaw" risk.
Historical Parallels
The current situation bears a striking resemblance to the 2022 energy-price-spike-and-subsequent-correction cycle, where geopolitical tension created a temporary supply-side shock that was eventually mitigated by diplomatic intervention. However, the tech-liquidity component is more reminiscent of the 2020 COVID-era sell-off, where retail capitulation drove a market-wide liquidity drain. The combination of these two—a fundamental energy reset and a technical tech-liquidity trap—is rare. Historically, this has led to a period of "bifurcated volatility," where energy-exposed assets underperform while industrials and defensive cyclicals begin to consolidate.
Outlook & Risk Matrix
Short-Term (1-5 Days)
The market is in a "show me" phase. The immediate reaction to the Iran news will likely be a consolidation of energy prices, while the equity markets will continue to struggle with the liquidity drain. Expect elevated volatility in NQ=F and ES=F.
Medium-Term (1-4 Weeks)
If the diplomatic de-escalation holds, we expect a structural shift in the energy term structure. The "war premium" will be fully priced out, and the market will refocus on supply/demand fundamentals. For equities, the key is whether the liquidity drain is a "flash" event or a structural shift. If the latter, we could see a broader, more prolonged correction.
Risk Matrix
Bull Scenario: Diplomatic de-escalation leads to a stable energy price floor, and the Fed signals a pause in tightening, allowing the tech sector to stabilize and recover.
Bear Scenario: The diplomatic thaw fails, leading to a "re-escalation" spike in energy prices, combined with a persistent liquidity drain that forces further deleveraging in tech.
Base Scenario: A period of "choppy consolidation" where energy prices trade in a lower range, and equity markets undergo a painful but necessary valuation reset.
What to Watch
The Iran-US Proposal Details: Any signal that the seven conditions are being met (or rejected) will be the primary driver for energy volatility.
Liquidity Indicators: Watch the volume on ES=F and NQ=F. If volumes remain elevated, the deleveraging is ongoing. If they dry up, it could signal that the selling is exhausted.
The 'Transition Trap' Narrative: Monitor NG=F and LNG-linked infrastructure stocks. If the "geopolitical stability" narrative takes hold, we may see a long-term shift in how these assets are valued.
USDINR & FII Flows: This remains the canary in the coal mine for emerging markets. If the rupee stabilizes, it suggests that the "energy-importing growth" trade is still viable despite the global yield trap.
Education and market research only, not financial advice. Charts are OCS AI Trader readings at the time of writing and change with new bars.