The Trust Bank Pivot: Institutionalizing Crypto Liquidity and the Banking Disintermediation Cycle
Executive summary
The digital asset landscape is undergoing a structural transformation, moving from a speculative frontier toward a regulated, institutional-grade financial ecosystem. The primary driver of this shift is the pursuit of national trust bank charters for stablecoin custody—most notably by infrastructure firms like Modern Treasury—which is catalyzing a liquidity migration. This move, bolstered by the broader regulatory pivot seen in the withdrawal of restrictive FinCEN rules and the strategic lobbying of groups like Fairshake, is creating a "regulatory moat" around compliant crypto assets.
We are tracing a four-layer impact chain: the direct legitimization of custody is triggering a secondary rotation of institutional capital into regulated proxies (IBIT, FBTC). This, in turn, is propagating macro consequences, specifically the disintermediation of traditional banking fee structures (XLF, HDFCB) and the creation of a "Yield-Arbitrage Trap" for corporate treasurers. As crypto assets gain institutional parity, their correlation with traditional macro drivers—like real yields—is shifting, creating new non-obvious dependencies on semiconductor demand for on-chain compute.
The current posture for IBIT is bullish, characterized by strong delta-driven accumulation and momentum. While Chart 1 — Signals + Liquidity holds a formal 'Weakness Below' short declaration, the actual price action has invalidated the bearish trigger and stop, while Chart 2 — Delta + Technical shows aligned ascending liquidity cycles and net buying CVD pressure. The synthesis suggests the bearish signal is lagging or structurally broken, superseded by bullish delta force.
OCS Confluence
Grade
Directional Bias
Participation State
medium
bullish
active
Setup Read: IBIT exhibits bullish delta accumulation and liquidity alignment despite a conflicting bearish signal declaration that has been structurally superseded by price action.
Bullish momentum reflected in both green strength bands and green CVD columns (Chart 1 & Chart 2)
Contradictions
Chart 1 Signal Engine declares a 'Weakness Below' SHORT bias, whereas Chart 2 Delta Engine shows net buying accumulation and a bullish trend-continuation long bias
Chart 1 identifies price as having cleared the weakness trigger/stop, creating a conflict with its own formal bearish declaration
Levels To Watch
48.74: EMA 9 Close (Chart 2)
49.34: Structural Invalidation/Stop (Chart 1)
47.47: Weakness Trigger Level (Chart 1)
46.62: T1 Target (Chart 1)
46.23: EMA 21 Close (Chart 2)
Invalidation
Structural failure occurs if price moves below the stop level of 49.34 (Chart 1).
Risk Notes
Conflict between signal declaration and actual delta/liquidity flow
Potential for momentum exhaustion near RSI 66.78 (Chart 2)
IBIT — Signals + Liquidity (click to expand)
Visible Context
Symbol
Timeframe
Layout Confidence
iShares Bitcoin Trust
1D
high
Signal Engine
Direction
Declaration
Trigger
Trigger Status
Stop / Invalidation
SHORT
Weakness Below
47.47
Triggered
49.34
Target Ladder
T1
T2
T3
T4
T5
Booked
Next Unbooked
46.62
45.79
44.55
N/A
N/A
None
N/A
Structure Context
Float-Volume Zones
Momentum Band
Dominant Cycle
Price Location
Structural Context
Price is currently above the blue secondary order block and the gray average float-volume zone.
strength; price is trading within the green strength band
bullish; green ribbon is expanding upward beneath price action
Price is above the trigger (47.47) and stop (49.34), having cleared the weakness declaration zone.
The setup is conflicting as price has moved above the weakness declaration trigger and stop, despite the formal Weakness Below label.
Setup Read
State
R:R to T1
R:R to Furthest
Invalidation
Evidence Quality
Notes
active
N/A
N/A
Stop at 49.34
high
Price is trading above the weakness trigger, within the green strength band, and has successfully retested the blue secondary order block.
IBIT — Delta + Technical (click to expand)
OCS Layout Presence
Delta Configuration Badge
Delta Histogram / CVD
Liquidity Overlay / Cycle
Ocs Ai Trader | Delta Configuration
Green CVD columns showing net buying accumulation, accompanied by a positive dominant cycle and adaptive delta filters.
Visible positive liquidity band (light green) and stepped liquidity cycle lines overlaying price.
Liquidity Engine
Active Band
Vs Slow Liquidity
Vs Fast Liquidity
Cycle State
Divergence
Hands-Off Risk
positive
above
above
slow and fast cycle lines are aligned and ascending
Positive liquidity band and positive dominant cycle with green CVD columns suggest bullish momentum.
None visible.
48.74
Layer 1: Direct Impacts — The Custody Paradigm Shift
The immediate catalyst is the aggressive pursuit of federal trust bank charters for digital asset custody. This is not merely a procedural update; it is a fundamental shift in the "trust" architecture of the crypto market.
Institutional Adoption: By bringing stablecoin custody under the aegis of a national trust bank, firms are effectively removing the "shadow banking" stigma that has historically kept large-scale institutional capital on the sidelines. This reduces counterparty risk, which is the single largest barrier to entry for pension funds and corporate treasuries.
Regulatory Clarity: The withdrawal of FinCEN’s proposed rules on unhosted wallets and mixers, coupled with the political spending of Fairshake to back candidates favoring the CLARITY bill, signals a broader deregulatory and pro-innovation environment. This reduces the "compliance discount" that has plagued crypto equities (COIN) and spot assets (BTC, ETH).
The Yield-Headwind Paradox: Despite the bullish regulatory environment, high US Treasury yields continue to exert pressure. For non-yielding assets like BTC and ETH, the opportunity cost remains elevated. However, as custody becomes standardized, the narrative is shifting from "speculative asset" to "institutional collateral," which may eventually decouple these assets from pure rate sensitivity.
Layer 2: Secondary Effects — Sector Rotation and Infrastructure
As the "trust bank" model takes hold, we see a distinct rotation in capital flows and competitive dynamics.
The "Quality" Premium: We are observing a liquidity bifurcation. Capital is actively rotating from speculative, non-custodial alt-coins into assets that fit the "regulated-custody" framework (BTC, ETH, and their associated ETFs like IBIT and FBTC). This creates a "quality premium" where these assets are less sensitive to retail-driven volatility and more tied to systematic institutional inflows.
Infrastructure Disintermediation: The rise of Modern Treasury and similar platforms directly threatens the fee-based revenue models of traditional correspondent banking. Banks like HDFCB, which rely heavily on cross-border settlement fees, face a long-term erosion of their moat as on-chain settlement becomes more efficient and cheaper than legacy SWIFT-based rails.
Enterprise Integration: The standardization of custody allows corporate treasurers to treat stablecoins as cash equivalents. This is not just a crypto story; it is an ERP (Enterprise Resource Planning) story. As stablecoins integrate into standard treasury systems, the velocity of money on-chain will increase, driving demand for the underlying blockchain networks.
Layer 3: Macro Propagation — The Banking-Crypto Convergence
The ripples from this shift are moving from crypto-native venues into the broader global financial system.
The Banking Squeeze: The disintermediation of traditional settlement is a structural headwind for the financial sector (XLF). As crypto-custody providers take on the role of "trust banks," they are effectively becoming the new correspondent banks. This will likely lead to a structural re-rating of financial stocks that fail to pivot to on-chain infrastructure.
Liquidity Bifurcation: The institutional mandate for "regulated custody" is creating a liquidity drain from the "wild west" of the crypto ecosystem. We expect to see a widening spread between regulated crypto proxies and offshore, non-KYC assets. This is a macro-level risk for exchanges that rely on high-volume, non-compliant trading activity.
Treasury Velocity: As enterprise treasurers adopt stablecoins, the demand for settlement tokens (BTC, ETH, SOL) will become less about speculative momentum and more about "utility demand." This anchors these assets to corporate balance sheets, potentially dampening their volatility in the long run.
Layer 4: Non-Obvious Connections — The Hidden Feedback Loops
This is where the institutional-grade analysis diverges from retail sentiment.
The Yield-Arbitrage Trap: Corporate treasurers now face a binary choice: hold cash in yield-bearing T-bills or move to stablecoins for on-chain utility. If the "utility premium" (the efficiency gain of on-chain settlement) exceeds the spread offered by T-bills, we will see a massive, non-price-sensitive inflow into stablecoin rails. This creates a feedback loop where high rates (which usually hurt crypto) actually incentivize the adoption of on-chain infrastructure to capture efficiency gains.
Semiconductor Demand via Tokenization: The tokenization of US equities is not just a "crypto" trend; it is a "compute" trend. To maintain verifiable state-proofs for on-chain equity trading, the underlying blockchain networks require massive, verifiable compute power. This creates a hidden, structural demand layer for high-end GPUs (NVDA), linking the crypto-liquidity cycle directly to the semiconductor capex cycle.
The 'Safe Haven' Substitution: As BTC gains "institutional-grade" status through trust bank charters, it is beginning to compete directly with Gold (GLD/XAU) as a systemic hedge. If institutional custody succeeds in reducing counterparty risk, we expect the correlation between BTC and Gold to shift from positive to negative during periods of market stress, as BTC becomes a "digital gold" that is actually easier to move and settle than physical bullion.
Unified OCS Chart Read
Status: Setup pending.
Technical Snapshot:
BTC: Showing resilience with a 1.75% gain ($37.90). RSI is at 63.71, indicating momentum is building but not yet overextended. The price is trading above the 20-day SMA ($35.92), confirming a bullish trend.
ETH: Similar momentum profile with an RSI of 62.04. The tight range ($25.55 - $26.04) suggests consolidation before a potential breakout, supported by the EMA(9) at $25.45.
COIN: Outperforming with a 2.85% gain. The RSI at 49.37 suggests it has significant room to run before hitting overbought territory, particularly as the "regulatory moat" narrative strengthens.
Conclusion: The technicals confirm a bullish consolidation phase across the majors. The lack of overextended RSI levels suggests that the current move is driven by structural accumulation rather than retail "FOMO" exhaustion. We remain watchful for a move above the upper Bollinger bands, which would signal a potential volatility expansion.
Security-by-Security Analysis
BTC (Bitcoin)
Fig. 3 COIN — Signals + Liquidity · open full sizeFig. 4 COIN — Delta + Technical · open full sizeCOIN — Unified OCS chart read
Executive Summary
COIN is currently caught in a structural tug-of-war between bearish price action and bullish delta accumulation. While Chart 1 — Signals + Liquidity identifies a weakness signal as price tests a pink float-volume resistance zone (191.05), Chart 2 — Delta + Technical reports positive liquidity and net buying pressure in the CVD. The current state is one of high-level testing near a resistance zone following previous target completions.
OCS Confluence
Grade
Directional Bias
Participation State
low
neutral
unclear
Setup Read: COIN is exhibiting divergent behavior as price tests a pink float-volume resistance zone despite underlying bullish delta accumulation.
Confirmations
Price is currently testing a pink float-volume zone (Chart 1 — Signals + Liquidity) while maintaining position above bullish liquidity lines (Chart 2 — Delta + Technical).
The setup is noted as 'exhausted' following booked upside targets (Chart 1 — Signals + Liquidity) while CVD shows net buying accumulation (Chart 2 — Delta + Technical).
Contradictions
Chart 1 — Signals + Liquidity declares a 'SHORT: Weakness Below' bias due to price testing the pink resistance zone, whereas Chart 2 — Delta + Technical identifies a 'trend-continuation long' bullish bias supported by net buying and positive liquidity.
Structural failure occurs if price breaks below the 199.75 invalidation level (Chart 1 — Signals + Liquidity) or fails to hold the 184.00 liquidity support boundary (Chart 2 — Delta + Technical).
Risk Notes
Exhaustion risk following a series of booked upside targets (Chart 1 — Signals + Liquidity).
Conflict between price-action weakness and delta-driven buying (Chart 1 vs Chart 2).
COIN — Signals + Liquidity (click to expand)
Visible Context
Symbol
Timeframe
Layout Confidence
COIN
1D
high
Signal Engine
Direction
Declaration
Trigger
Trigger Status
Stop / Invalidation
SHORT
Weakness Below
191.05
Triggered
199.75
Target Ladder
T1
T2
T3
T4
T5
Booked
Next Unbooked
183.48 (Booked)
179.67 (Booked)
N/A
168.25
N/A
T1, T2
T4 at 168.25
Structure Context
Float-Volume Zones
Momentum Band
Dominant Cycle
Price Location
Structural Context
Price is currently rejecting/testing a pink extreme float-volume zone near 191-200.
weakness (price is within/near the pink momentum band)
transition (flattening ribbon near recent price peaks)
Price is below the trigger (191.05) and within the pink weakness band, testing the pink float-volume zone.
The setup is crowded as several upside targets have already been booked, leading to a test of the pink resistance zone.
Setup Read
State
R:R to T1
R:R to Furthest
Invalidation
Evidence Quality
Notes
exhausted
N/A
N/A
Stop at 199.75 or breakdown below the pink weakness zone.
high
Price is currently testing the pink weakness zone following a series of booked upside targets.
COIN — Delta + Technical (click to expand)
OCS Layout Presence
Delta Configuration Badge
Delta Histogram / CVD
Liquidity Overlay / Cycle
Ocs Ai Trader | Delta Configuration badge visible in the center panel
Green CVD columns indicating net buying and green delta-force arrows visible
Visible liquidity bands (green/red/shaded) and cycle lines overlaid on price and delta panels
Liquidity Engine
Active Band
Vs Slow Liquidity
Vs Fast Liquidity
Cycle State
Divergence
Hands-Off Risk
positive liquidity band with price currently sitting within the bullish zone
above slow positive liquidity line
above fast positive liquidity line
fast/slow cycle alignment (positive)
none
low
Delta Engine
CVD Pressure
Dominant Cycle Leader
Adaptive Filter
Delta Force
Exhaustion Boundary
net buying
positive
bullish floor
recent green arrows
none
Secondary TA
EMA
RSI
MACD
EMA 9: 189.31, EMA 21: 186.72
RSI 14: 52.55
MACD 12 26 9: -1.32 3.98 5.30
Confluence
Setup Type
Directional Bias
Conviction
Confirmation
Contradiction
Key Level
trend-continuation long
bullish
medium
Positive liquidity band and net buying accumulation in CVD columns support the current bullish structure.
None visible.
184.00 (liquidity support boundary)
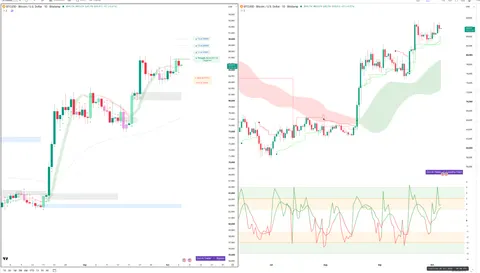
Fig. 5 BTC — Signals + Liquidity · open full sizeFig. 6 BTC — Delta + Technical · open full sizeBTC — Unified OCS chart read
Executive Summary
The consensus view is a high-conviction bullish trend continuation. While the Signal Engine (Chart 1) notes the setup is technically 'exhausted' after clearing T1-T3 targets, the Delta and Liquidity engines (Chart 2) show robust net buying pressure and price holding at the upper boundary of a positive liquidity band. The primary divergence is between the price's extended location (Chart 1) and the ongoing strength of the delta-force accumulation (Chart 2).
OCS Confluence
Grade
Directional Bias
Participation State
high
bullish
exhausted
Setup Read: BTC maintains a bullish regime characterized by positive liquidity alignment and trend continuation, though price is currently testing upper volume-related resistance following target completion.
Confirmations
Bullish cycle alignment across both Signal Engine (Chart 1) and Delta/Liquidity Engines (Chart 2).
Price maintains position above critical structural supports and liquidity bands.
Strong participation confirmed by green CVD accumulation (Chart 2) and riding the green ribbon support (Chart 1).
Contradictions
(none)
Levels To Watch
85,756 (Trigger - Chart 1)
85,796 (Key Level - Chart 2)
84,251 (Stop/Invalidation - Chart 1)
Upper boundary of positive liquidity band (Chart 2)
Upper volume-related resistance (Chart 1)
Invalidation
Structural failure occurs if price falls below the 84,251 stop level (Chart 1).
Risk Notes
Price is in an extended state, having surpassed all visible targets (Chart 1).
Testing of upper volume-related resistance (Chart 1).
Low hands-off risk due to alignment of fast and slow liquidity cycles (Chart 2).
BTC — Signals + Liquidity (click to expand)
Visible Context
Symbol
Timeframe
Layout Confidence
BTCUSD - Bitcoin / U.S. Dollar : 1D
1D
high
Signal Engine
Direction
Declaration
Trigger
Trigger Status
Stop / Invalidation
LONG
Strength Above
85,756
Triggered
84,251
Target Ladder
T1
T2
T3
T4
T5
Booked
Next Unbooked
86,776
89,576
93,756
N/A
N/A
T1, T2, T3
N/A
Structure Context
Float-Volume Zones
Momentum Band
Dominant Cycle
Price Location
Structural Context
Price is currently in open space above the blue secondary order block and gray average float-volume zones.
strength; price is trading within the green strength band.
bullish; price is riding above the green ribbon support following a regime transition.
Price is currently above the trigger (85,756) and the stop (84,251), but has surpassed the last visible target (T3).
The setup is extended as price has cleared all visible targets and is currently testing upper volume-related resistance.
Setup Read
State
R:R to T1
R:R to Furthest
Invalidation
Evidence Quality
Notes
exhausted
N/A
N/A
Stop at 84,251
high
Price is currently within a green momentum band and above the dominant cycle support, testing historical volume zones near recent targets.
BTC — Delta + Technical (click to expand)
OCS Layout Presence
Delta Configuration Badge
Delta Histogram / CVD
Liquidity Overlay / Cycle
Ocs Ai Trader | Delta Configuration badge is visible in the center-left of the chart area.
Visible green CVD accumulation columns and green delta-force arrows at the bottom panel.
Visible positive liquidity band (light green) and stepped liquidity lines overlaying the price action.
Liquidity Engine
Active Band
Vs Slow Liquidity
Vs Fast Liquidity
Cycle State
Divergence
Hands-Off Risk
positive liquidity band with price at the upper boundary
above slow positive liquidity line
above fast positive liquidity line
fast and slow cycle alignment
none
low
Delta Engine
CVD Pressure
Dominant Cycle Leader
Adaptive Filter
Delta Force
Exhaustion Boundary
net buying
positive
bullish floor
absent
none
Secondary TA
EMA
RSI
MACD
EMA 9 and EMA 21 are visible.
RSI 14 is visible.
MACD with signal line is visible.
Confluence
Setup Type
Directional Bias
Conviction
Confirmation
Contradiction
Key Level
trend-continuation long
bullish
high
Price is holding within a positive liquidity band supported by a positive dominant cycle and green CVD accumulation columns.
None visible.
85,796
* **Snapshot:** $37.90 (+1.75%).
* **Analysis:** BTC is the primary beneficiary of the "trust bank" narrative. Its status as the "institutional collateral" of choice is being cemented.
* **Levels:** Watch the $38.50 resistance level. A break above this, supported by volume, would confirm the next leg of institutional accumulation.
* **Risk:** High sensitivity to US 2Y yields. If the "Yield-Arbitrage Trap" shifts against stablecoins, BTC could face short-term pressure.
ETH (Ether)
Fig. 7 ETH — Signals + Liquidity · open full sizeFig. 8 ETH — Delta + Technical · open full sizeETH — Unified OCS chart read
Executive Summary
The consensus view is a bullish trend-continuation characterized by active participation above the trigger level. Structural strength is evidenced by the green momentum band and positive cycle support (Chart 1), which is reinforced by net buying accumulation and positive liquidity bands (Chart 2). While delta force markers show minor local exhaustion (Chart 2), the overall setup maintains confluence between signal strength and liquidity flow.
OCS Confluence
Grade
Directional Bias
Participation State
high
bullish
active
Setup Read: ETH exhibits a high-conviction bullish structure with price trading within momentum strength bands and supported by net buying accumulation above key liquidity lines.
Confirmations
Alignment of positive cycle support (Chart 1) with positive liquidity bands and upward trending slow/fast liquidity lines (Chart 2).
Price action maintains position above the Signal Engine trigger of 2709.59 (Chart 1) and above key liquidity lines (Chart 2).
Bullish momentum confirmed by green strength bands (Chart 1) and net buying accumulation in CVD (Chart 2).
Contradictions
MACD histogram and delta force markers indicate minor deceleration/exhaustion (Chart 2) despite the high-quality strength declaration (Chart 1).
Levels To Watch
2789.41: Next Unbooked Target (Chart 1)
2714.80: Confluence Key Level (Chart 2)
2709.59: Signal Trigger (Chart 1)
2681.73: Stop / Invalidation (Chart 1)
2697.73: EMA 9 (Chart 2)
2750.00: Float-Volume Reference Zone (Chart 1)
Invalidation
Structural failure occurs if price closes below the stop/invalidation level of 2681.73 (Chart 1).
Risk Notes
Minor deceleration/exhaustion visible in MACD and delta force markers (Chart 2).
Price is currently testing a gray float-volume reference zone (Chart 1).
ETH — Signals + Liquidity (click to expand)
Visible Context
Symbol
Timeframe
Layout Confidence
ETHUSD / Ethereum / U.S. Dollar - 1D - Coinbase
1D
high
Signal Engine
Direction
Declaration
Trigger
Trigger Status
Stop / Invalidation
LONG
Strength Above
2709.59
Triggered
2681.73
Target Ladder
T1
T2
T3
T4
T5
Booked
Next Unbooked
2714.77
2789.41
N/A
N/A
N/A
2714.77
2789.41
Structure Context
Float-Volume Zones
Momentum Band
Dominant Cycle
Price Location
Structural Context
Price is currently interacting with a gray average float-volume/order-block reference zone near 2750.
strength; price is oscillating within the green strength band.
bullish; green ribbon shows active positive cycle support beneath price action.
Price is above the trigger (2709.59) and the stop (2681.73), currently positioned between the trigger and the next unbooked target (2789.41).
The setup is clean, showing confluence between a strength declaration, positive cycle support, and momentum band alignment.
Setup Read
State
R:R to T1
R:R to Furthest
Invalidation
Evidence Quality
Notes
active
N/A
N/A
Stop at 2681.73
high
Price is currently trading within the green momentum strength band and above the latest strength declaration trigger, testing a gray float-volume reference zone.
ETH — Delta + Technical (click to expand)
OCS Layout Presence
Delta Configuration Badge
Delta Histogram / CVD
Liquidity Overlay / Cycle
Ocs Ai Trader | Delta Configuration
Green CVD columns indicating net buying accumulation, with delta force markers (arrows) visible at the bottom.
Visible positive liquidity band (green shading) and stepped liquidity lines/cycles.
Liquidity Engine
Active Band
Vs Slow Liquidity
Vs Fast Liquidity
Cycle State
Divergence
Hands-Off Risk
positive liquidity band
above slow positive liquidity line
above fast positive liquidity line
fast and slow lines both trending upward above price support
none
low
Delta Engine
CVD Pressure
Dominant Cycle Leader
Adaptive Filter
Delta Force
Exhaustion Boundary
net buying
positive
bullish floor
recent green arrows followed by minor red markers
none
Secondary TA
EMA
RSI
MACD
EMA 9: 2,697.73, EMA 21 close: 2,632.38
RSI 14 close: 61.97, 62.44
MACD close 12 26 9: 61.26, 70.88
Confluence
Setup Type
Directional Bias
Conviction
Confirmation
Contradiction
Key Level
trend-continuation long
bullish
medium
Price is currently trending above both the slow and fast positive liquidity lines within a positive liquidity band, supported by net buying accumulation in the CVD.
The MACD histogram and delta force markers show some minor deceleration/exhaustion at recent local highs.
2,714.80
* **Snapshot:** $25.83 (+1.45%).
* **Analysis:** ETH is capturing the "utility demand" from tokenization and on-chain settlement. Its correlation with NVDA and the broader tech-compute cycle is increasing.
* **Levels:** $26.50 is the critical pivot. Above this, the path to $28.00 opens up.
* **Risk:** Regulatory scrutiny on DeFi remains a latent threat, though the current pivot to "trust bank" models mitigates this.
COIN (Coinbase)
Snapshot: $188.22 (+2.85%).
Analysis: COIN is the infrastructure play. As the regulatory moat expands, COIN’s compliance-first strategy becomes its biggest competitive advantage.
Levels: $200 is the psychological and technical barrier. A sustained close above this level would signal a major structural shift in market sentiment toward the stock.
XLF (Financial Sector ETF)
Fig. 9 XLF — Signals + Liquidity · open full sizeFig. 10 XLF — Delta + Technical · open full sizeXLF — Unified OCS chart read
Executive Summary
The composite read for XLF is strongly bearish, characterized by a completed downside move through all labeled targets in Chart 1 and current price testing fast negative liquidity lines in Chart 2. Participation is currently driven by net selling and negative delta force, with price residing within a momentum-driven 'weakness band' and exhibiting bearish divergence in the liquidity cycle. The setup is a trend-continuation short, moving from historical target completion toward new unbooked downside space.
OCS Confluence
Grade
Directional Bias
Participation State
high
bearish
active
Setup Read: XLF is exhibiting a high-conviction bearish continuation as price trends through weakness bands and tests fast negative liquidity lines following the successful booking of all previous downside targets.
Confirmations
Consensus bearish regime: Chart 1 identifies a 'pink weakness band' while Chart 2 confirms 'net selling' via CVD pressure.
Structural alignment: Price is trending through downside space (Chart 1) while testing fast negative liquidity lines (Chart 2).
Momentum synchronization: Chart 1 notes bearish ribbon expansion, which aligns with the red delta-force arrows and red CVD columns in Chart 2.
Contradictions
(none)
Levels To Watch
57.63 (Stop/Invalidation - Chart 1)
57.40 (Float-Volume/Order-Block Zone - Chart 1)
55.13 (EMA 21 - Chart 2)
54.15 (EMA 5 - Chart 2)
53.50 (Fast Negative Liquidity Area - Chart 2)
Invalidation
Structural failure occurs if price breaches the 57.63 stop level (Chart 1).
Risk Notes
Exhaustion risk: Price is testing fast negative liquidity lines (Chart 2) which can precede local reversals.
Momentum context: Price is currently in a net-bearish composite regime (Chart 1).
XLF — Signals + Liquidity (click to expand)
Visible Context
Symbol
Timeframe
Layout Confidence
XLF
1D
high
Signal Engine
Direction
Declaration
Trigger
Trigger Status
Stop / Invalidation
SHORT
Weakness Below
57.20
Triggered
57.63
Target Ladder
T1
T2
T3
T4
T5
Booked
Next Unbooked
57.06 (Booked)
56.76 (Booked)
56.51 (Booked)
55.77 (Booked)
55.32 (Booked)
T1, T2, T3, T4, T5
T6 N/A
Structure Context
Float-Volume Zones
Momentum Band
Dominant Cycle
Price Location
Structural Context
Price is currently below the gray float-volume/order-block zone at 57.40 and trending through a red/pink extreme zone.
weakness (price is within the pink weakness band)
bearish (pink ribbon expansion)
Price is below the trigger of 57.20 and below all booked targets, moving toward unbooked downside space.
The setup follows a clean downside declaration with all labeled targets successfully booked.
Setup Read
State
R:R to T1
R:R to Furthest
Invalidation
Evidence Quality
Notes
active
N/A
N/A
Stop at 57.63
high
Price is currently in a net-bearish composite regime, rejecting a gray float-volume zone and trending within a pink weakness band toward unbooked downside targets.
XLF — Delta + Technical (click to expand)
OCS Layout Presence
Delta Configuration Badge
Delta Histogram / CVD
Liquidity Overlay / Cycle
Ocs Ai Trader | Delta Configuration
red CVD columns and red delta-force arrows visible
visible negative liquidity bands and stepped liquidity lines
Liquidity Engine
Active Band
Vs Slow Liquidity
Vs Fast Liquidity
Cycle State
Divergence
Hands-Off Risk
negative, price testing fast negative liquidity line
Price is currently testing the fast negative liquidity line within a negative liquidity band, accompanied by recent red delta-force arrows and red CVD columns.
* **Snapshot:** $53.88 (+0.73%).
* **Analysis:** XLF is the "silent loser" in this narrative. The disintermediation of correspondent banking is a long-term drag on the traditional financial sector.
* **Risk:** Watch for underperformance relative to tech indices. If crypto-custody becomes the new standard, XLF’s fee-based revenue will be under constant pressure.
Historical Parallels
The current regulatory pivot is reminiscent of the 2004 Gold ETF (GLD) approval. Prior to 2004, gold was a cumbersome asset for institutions to hold; the ETF wrapper transformed it into a liquid, institutional-grade asset. We are seeing the exact same process with BTC and ETH via IBIT, FBTC, and now the "trust bank" custody model. Just as GLD led to a decade-long bull run in gold prices by unlocking institutional capital, the current "trust bank" narrative is the foundational step for a similar structural re-rating of the crypto asset class.
Outlook & Risk Matrix
Short-Term (1-5 Days)
Outlook: Bullish consolidation. Expect continued accumulation as the market prices in the "trust bank" news.
Key Levels: BTC $38.50, ETH $26.50.
Scenario: If the market reacts positively to the next set of regulatory updates, expect a test of these resistance levels.
Medium-Term (1-4 Weeks)
Outlook: Structural rotation. The market will begin to differentiate more sharply between "regulated" and "speculative" assets.
Key Risks:
Yield-Arbitrage Trap: If US 2Y yields spike, the "utility premium" of stablecoins may be tested.
Regulatory Surprise: While the current trend is pro-innovation, the SEC/CFTC could pivot if systemic risk concerns arise from the new custody models.
What to Watch
OCC Charter Decisions: Any further approvals or denials for trust bank charters will be the primary driver of volatility.
Stablecoin Velocity Data: Watch for on-chain data regarding the volume of stablecoins moving through regulated custody providers. This is the "real-time" indicator of institutional adoption.
NVDA/Semiconductor Capex: Monitor earnings and guidance from major chipmakers. If their growth is increasingly tied to "blockchain infrastructure" rather than just "AI training," it confirms our Layer 4 thesis.
Treasury Yields: The 2Y yield remains the "gravity" for the crypto market. Any significant hawkish repricing of the Fed will act as a headwind, regardless of the regulatory tailwinds.
Education and market research only, not financial advice. Charts are OCS AI Trader readings at the time of writing and change with new bars.