The Digital Ruble Squeeze: Bifurcation and the New Crypto Reality
Executive summary
The crypto market is entering a structural "bifurcation era," driven by a collision between sovereign digital currency initiatives and Western regulatory frameworks. The recent move by the Russian Finance Ministry to initiate salary payments in digital rubles, coupled with Japan’s inclusion of Garantex on its sanctions list, has catalyzed a major liquidity shift.
We are witnessing the emergence of a "Financial Iron Curtain" within the digital asset ecosystem. Institutional capital is increasingly insulating itself within regulated, SEC-approved ETFs (IBIT, FBTC), effectively creating a "clean" liquidity pool that ignores domestic regulatory noise. Simultaneously, crypto-native equity proxies (COIN, MSTR) face a heightened regulatory risk premium as they navigate the fallout of AML/KYC compliance in a fragmented global market. The non-obvious outcome? A widening divergence between the underlying assets (BTC, ETH) and their equity proxies, as BTC increasingly functions as a censorship-resistant, neutral reserve asset—a role bolstered by the decline of private stablecoin utility in sanctioned jurisdictions.
The Cascading Impact Chain
Layer 1: Direct Impacts (The Trigger)
The immediate catalyst is the operationalization of the digital ruble for state-sector salary payments. This is not merely a technical update; it is a fundamental shift in the Russian financial architecture. By bypassing traditional banking rails, the digital ruble reduces state reliance on USD-pegged stablecoins for cross-border and internal settlements. Simultaneously, the Japanese government’s sanctioning of Garantex—a platform frequently utilized for cross-border crypto flows—has tightened the net on non-compliant, offshore venues. These events are forcing a rapid recalibration of where liquidity flows and, more importantly, where it is permitted to reside.
Layer 2: Secondary Effects (Sector Rotation)
The direct impact of these sanctions is a liquidity bifurcation. Institutional investors are fleeing the operational uncertainty of offshore crypto venues, choosing instead the "safe harbor" of regulated US-based ETFs (IBIT, FBTC). This creates a decoupling effect: while the underlying asset (BTC) benefits from safe-haven demand, the infrastructure proxies (COIN) are being penalized for their exposure to the very "shadow liquidity" that is now being purged from the system. We are observing a rotation out of crypto-native equities, which carry the baggage of KYC/AML compliance, and into spot-equivalent products that offer regulatory insulation.
The macro implication is the potential obsolescence of private stablecoins within the Russian sphere of influence. As the digital ruble gains state-mandated utility, the demand for USD-pegged stablecoins for wage and trade settlement is likely to erode. This forces a shift in demand toward native Layer-1 assets (BTC, ETH) as stores of value. This is a classic "flight-to-quality" move, but one that occurs across a digital frontier. As non-Western central banks and sanctioned entities seek non-sovereign, censorship-resistant reserves, the correlation between BTC and gold (GLD) is tightening, reflecting a shared status as the only truly neutral assets in a bifurcated global financial system.
Layer 4: Non-Obvious Connections (The Compliance-Liquidity Paradox)
The most critical, yet overlooked, dynamic is the "Compliance-Liquidity Paradox." As the digital ruble forces Russian capital into non-KYC/offshore pools, exchanges like Coinbase (COIN) face an impossible choice: either adopt draconian de-risking protocols that alienate global volume, or accept the regulatory risk premium. This creates a divergence where BTC price action is increasingly driven by macro-monetary factors (FOMC, DXY) and safe-haven demand, while COIN’s valuation is suppressed by the operational cost of "compliance moats."
We are effectively seeing a two-tier pricing model:
Institutional "Clean" BTC: Traded via ETFs, insulated from regulatory friction.
"Shadow" BTC: Traded on offshore/decentralized venues, carrying a geopolitical risk premium.
Unified OCS Chart Read
Note: OCS chart evidence is currently deferred to the asynchronous enrichment queue. No technical levels from the OCS engine are available at this time. The following analysis is derived from market data, volatility metrics, and the macro-causal framework.
Status: Setup read is currently hands-off for tactical entries until liquidity fragmentation stabilizes. The bifurcation of "clean" vs. "shadow" liquidity means that traditional technical indicators (RSI, Bollinger Bands) may yield false signals due to the liquidity gap between regulated and unregulated venues.
Security-by-Security Analysis
BTC (Bitcoin)
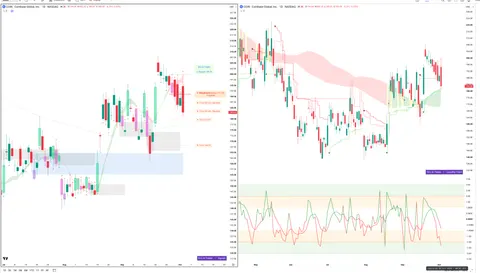
Fig. 1 COIN — Signals + Liquidity · open full sizeFig. 2 COIN — Delta + Technical · open full sizeCOIN — Unified OCS chart read
Executive Summary
The COIN setup currently exhibits a structural divergence between price action and delta flow. While Chart 1 — Signals + Liquidity identifies a bearish structural rejection at the 191.05 pink float-volume zone following the completion of three downside targets, Chart 2 — Delta + Technical shows bullish participation with net buying CVD and price holding above positive liquidity lines. The current state is a battle between bearish structural resistance and bullish delta accumulation.
OCS Confluence
Grade
Directional Bias
Participation State
low
neutral
unclear
Setup Read: COIN is currently navigating a conflict between bearish float-volume resistance at 191.05 and bullish delta accumulation above positive liquidity lines.
Confirmations
Price is interacting with a high-volume structural zone (Chart 1 — Signals + Liquidity) while simultaneously maintaining position above slow/fast positive liquidity lines (Chart 2 — Delta + Technical).
The setup transitions from a completed short-side move (T1-T3) into a potential liquidity-driven trend continuation (Chart 1 — Signals + Liquidity & Chart 2 — Delta + Technical).
Contradictions
Chart 1 — Signals + Liquidity declares a SHORT bias based on weakness below 191.05, whereas Chart 2 — Delta + Technical indicates a BULLISH trend-continuation bias supported by net buying CVD and positive delta-force.
Structural failure occurs if price breaches the 193.75 level (Chart 1 — Signals + Liquidity).
Risk Notes
Structural bearishness vs. delta bullishness creates a high-uncertainty environment.
Exhaustion risk noted at the extreme pink volume zone (Chart 1 — Signals + Liquidity).
Potential for chop as price tests resistance while delta remains positive.
COIN — Signals + Liquidity (click to expand)
Visible Context
Symbol
Timeframe
Layout Confidence
COIN
1D
high
Signal Engine
Direction
Declaration
Trigger
Trigger Status
Stop / Invalidation
SHORT
Weakness Below
191.05
Triggered
193.75
Target Ladder
T1
T2
T3
T4
T5
Booked
Next Unbooked
187.25 (Booked)
183.67 (Booked)
179.67 (Booked)
168.25
N/A
T1, T2, T3
T4 at 168.25
Structure Context
Float-Volume Zones
Momentum Band
Dominant Cycle
Price Location
Structural Context
Price is currently rejecting the pink extreme float-volume zone at ~191.05.
weakness with price interacting with the pink weakness band
transition with flattening ribbon evidence
Price is below the trigger (191.05) and the stop (193.75), currently testing resistance near the pink zone.
The setup follows a successful completion of three targets, with price now encountering high-volume resistance in the pink zone.
Setup Read
State
R:R to T1
R:R to Furthest
Invalidation
Evidence Quality
Notes
exhausted
N/A
N/A
Stop at 193.75
high
Price is currently testing the extreme pink float-volume zone after a series of T1-T3 completions.
COIN — Delta + Technical (click to expand)
OCS Layout Presence
Delta Configuration Badge
Delta Histogram / CVD
Liquidity Overlay / Cycle
Ocs Ai Trader | Delta Configuration badge is visible in the center of the chart area
Green and red CVD columns are visible at the bottom panel, along with green delta-force arrows
Visible liquidity bands (green/red) and stepped liquidity lines are overlaid on the price action
Liquidity Engine
Active Band
Vs Slow Liquidity
Vs Fast Liquidity
Cycle State
Divergence
Hands-Off Risk
positive liquidity band, price is within it
above slow positive liquidity line
above fast positive liquidity line
fast and slow cycle lines are in positive alignment
none
low
Delta Engine
CVD Pressure
Dominant Cycle Leader
Adaptive Filter
Delta Force
Exhaustion Boundary
net buying
positive
bullish floor
green delta-force arrows visible
none
Secondary TA
EMA
RSI
MACD
EMA 20 and EMA 50 are visible
RSI is visible
MACD is visible
Confluence
Setup Type
Directional Bias
Conviction
Confirmation
Contradiction
Key Level
trend-continuation long
bullish
medium
Price is holding above the slow positive liquidity line with positive CVD columns showing accumulation.
None visible.
186.85
Fig. 3 BTC — Signals + Liquidity · open full sizeFig. 4 BTC — Delta + Technical · open full sizeBTC — Unified OCS chart read
Executive Summary
The consensus outlook is bullish, characterized by a high-conviction trend-continuation setup. Chart 1 — Signals + Liquidity identifies price in 'open space' above a triggered strength level (86773), while Chart 2 — Delta + Technical confirms this through net buying pressure and price holding at the upper edge of a positive liquidity band. The primary driver is the alignment of steep momentum cycles with active delta-force accumulation.
OCS Confluence
Grade
Directional Bias
Participation State
high
bullish
active
Setup Read: BTC is exhibiting a high-conviction bullish trend-continuation setup, supported by momentum-driven price expansion into open space and positive delta-force accumulation.
Confirmations
Both charts confirm a bullish dominant cycle (Chart 1: green ribbon; Chart 2: positive dominant delta cycle).
Price action is supported by positive liquidity and volume structures (Chart 1: open space above blue secondary OB; Chart 2: positive liquidity bands).
Trend-continuation momentum is aligned with net buying pressure (Chart 1: price above green strength band; Chart 2: green CVD accumulation columns).
Contradictions
(none)
Levels To Watch
86773 (Trigger - Chart 1)
89094 (T3 Target - Chart 1)
91391 (T4 Target - Chart 1)
93694 (T5 Target - Chart 1)
84251 (Stop/Invalidation - Chart 1)
84,000 (Key Confluence Level - Chart 2)
Invalidation
Structural failure occurs if price breaches the stop at 84251 (Chart 1) or fails to hold the 84,000 confluence level (Chart 2).
Risk Notes
Exhaustion risk noted as price has moved significantly above historical targets (Chart 1).
Low hands-off risk due to alignment of fast and slow liquidity cycles (Chart 2).
BTC — Signals + Liquidity (click to expand)
Visible Context
Symbol
Timeframe
Layout Confidence
BTCUSD - Bitcoin / U.S. Dollar
1D
high
Signal Engine
Direction
Declaration
Trigger
Trigger Status
Stop / Invalidation
LONG
Strength Above
86773
Triggered
84251
Target Ladder
T1
T2
T3
T4
T5
Booked
Next Unbooked
N/A
N/A
89094
91391
93694
None
N/A
Structure Context
Float-Volume Zones
Momentum Band
Dominant Cycle
Price Location
Structural Context
Latest price is in open space, having broken above the blue secondary order block zone.
strength; price is trending within/above the green strength band
bullish; green ribbon is steep and supporting price action
Price is above the trigger (86773) and the stop (84251), moving toward unbooked T3-T5 targets.
The setup is clean as price has successfully transitioned through previous float-volume zones into open space with momentum support.
Setup Read
State
R:R to T1
R:R to Furthest
Invalidation
Evidence Quality
Notes
exhausted
N/A
N/A
Stop at 84251
high
Price is currently trading above all established Strength Above declarations and momentum bands, having completed historical targets.
BTC — Delta + Technical (click to expand)
OCS Layout Presence
Delta Configuration Badge
Delta Histogram / CVD
Liquidity Overlay / Cycle
Ocs Ai Trader | Delta Configuration badge visible above the delta panel
Green and red CVD columns present with green delta-force arrows at the bottom
Visible positive liquidity bands (green shaded areas) and stepped liquidity lines on the price chart
Liquidity Engine
Active Band
Vs Slow Liquidity
Vs Fast Liquidity
Cycle State
Divergence
Hands-Off Risk
positive liquidity band with price at the upper edge
above slow positive liquidity line
above fast positive liquidity line
fast and slow cycle alignment
none
low
Delta Engine
CVD Pressure
Dominant Cycle Leader
Adaptive Filter
Delta Force
Exhaustion Boundary
net buying
positive
bullish floor
recent green arrows
none
Secondary TA
EMA
RSI
MACD
EMA 9 (red) and EMA 21 (blue) visible
RSI 14 close visible
MACD 12 26 9 visible
Confluence
Setup Type
Directional Bias
Conviction
Confirmation
Contradiction
Key Level
trend-continuation long
bullish
medium
Price is holding within a positive liquidity band supported by green CVD accumulation columns and a positive dominant delta cycle.
None visible.
84,000
* **Snapshot:** Price: $37.25. (Note: Data reflects current market levels).
* **Analysis:** BTC is decoupling from the regulatory noise surrounding its proxies. The asset is increasingly viewed as a geopolitical hedge. The rise of the digital ruble is a net positive for BTC’s narrative as a neutral reserve asset, provided it continues to attract institutional inflows via ETFs rather than speculative retail volume.
* **Risk Note:** Monitor the spread between IBIT/FBTC and spot BTC prices. A widening premium indicates "clean" liquidity demand; a narrowing suggests institutional caution.
COIN (Coinbase Global)
Snapshot: Price: $183.00 (-3.32%).
Analysis: COIN is the primary victim of the "Compliance-Liquidity Paradox." As it tightens AML/KYC to satisfy global regulators, it risks losing the very volume that drives its fee-based revenue model. The market is pricing in a "regulatory tax" on the firm's future earnings.
Risk Note: Watch for any further announcements regarding de-risking or service limitations in jurisdictions with high digital ruble adoption, as this will likely trigger a negative re-rating of the stock.
MSTR (MicroStrategy)
Fig. 5 MSTR — Signals + Liquidity · open full sizeFig. 6 MSTR — Delta + Technical · open full sizeMSTR — Unified OCS chart read
Executive Summary
The setup is currently in a state of structural divergence. While Chart 1 — Signals + Liquidity maintains a bearish declaration with a short trigger at 155.88, Chart 2 — Delta + Technical shows strong bullish absorption characterized by positive CVD pressure and price sustained above the positive liquidity band. Until the 155.88 level is breached, the price action remains in a 'pre-trigger' state relative to the bearish signal despite the immediate bullish delta flow.
OCS Confluence
Grade
Directional Bias
Participation State
low
neutral
pre-trigger
Setup Read: MSTR exhibits a conflict between a bearish structural declaration and aggressive bullish delta accumulation, with the bearish trigger remaining unreached at 155.88.
Confirmations
Price is currently maintaining position above key structural support levels mentioned in both layouts.
The 155.88 level serves as both a Chart 1 Short Trigger and a Chart 2 Key Confluence level (near EMA 200/Slow Liquidity).
Structural failure of the bearish thesis occurs if price remains above 170.17 (Chart 1 — Signals + Liquidity).
Risk Notes
Structural conflict between bearish signal engine and bullish delta/liquidity engine.
Price is currently testing resistance near a gray float-volume zone (Chart 1 — Signals + Liquidity).
Potential for chop while the price sits between the bullish liquidity zone and the bearish trigger level.
MSTR — Signals + Liquidity (click to expand)
Visible Context
Symbol
Timeframe
Layout Confidence
MSTR
1D
high
Signal Engine
Direction
Declaration
Trigger
Trigger Status
Stop / Invalidation
SHORT
Weakness Below
155.88
Not Triggered
170.17
Target Ladder
T1
T2
T3
T4
T5
Booked
Next Unbooked
149.51
143.31
137.03
N/A
N/A
None
T1 at 149.51
Structure Context
Float-Volume Zones
Momentum Band
Dominant Cycle
Price Location
Structural Context
Price is currently rejecting a gray average float-volume zone near 175.00
weakness; price is currently trading within the pink weakness band
transition; the ribbon is flattening/curving after a recent bearish descent
Price is above the trigger of 155.88 and above all listed targets, currently testing resistance near 175.00
The setup is conflicting as the structural declaration is bearish but price is currently trading well above the trigger and targets.
Setup Read
State
R:R to T1
R:R to Furthest
Invalidation
Evidence Quality
Notes
pre-trigger
N/A
N/A
Stop at 170.17
high
Price is currently testing a pink momentum weakness band and rejecting a gray float-volume zone, while the structural declaration remains 'Weakness Below' with the trigger not yet reached.
MSTR — Delta + Technical (click to expand)
OCS Layout Presence
Delta Configuration Badge
Delta Histogram / CVD
Liquidity Overlay / Cycle
Ocs Ai Trader | Delta Configuration | 15M
Green CVD columns indicating buying accumulation and green delta-force arrows at the bottom of the delta panel.
Visible positive liquidity band (shaded green) and stepped liquidity lines.
Liquidity Engine
Active Band
Vs Slow Liquidity
Vs Fast Liquidity
Cycle State
Divergence
Hands-Off Risk
positive liquidity band, price currently in bullish zone
above slow positive liquidity line
above fast positive liquidity line
fast and slow cycle alignment (bullish)
none
low
Delta Engine
CVD Pressure
Dominant Cycle Leader
Adaptive Filter
Delta Force
Exhaustion Boundary
net buying
positive
bullish floor
recent green arrows
none
Secondary TA
EMA
RSI
MACD
EMA 9 (blue) and EMA 200 (red/orange) visible
RSI 14 close visible
MACD 12 26 9 visible
Confluence
Setup Type
Directional Bias
Conviction
Confirmation
Contradiction
Key Level
trend-continuation long
bullish
high
Price is sustained above the positive liquidity band with a positive dominant cycle and green CVD columns indicating net buying accumulation.
None visible.
156.31 (Slow positive liquidity line/EMA 200)
* **Snapshot:** Price: $160.01 (-0.31%).
* **Analysis:** MSTR acts as a high-beta proxy for BTC but is now caught in the crossfire of the "regulatory risk premium." While its balance sheet remains heavily BTC-weighted, the market is discounting its valuation based on the potential for increased regulatory scrutiny on corporate crypto-holding structures.
* **Risk Note:** MSTR’s correlation to BTC may temporarily weaken if the market perceives its corporate structure as a target for regulatory oversight.
IBIT / FBTC (Bitcoin ETFs)
Fig. 7 FBTC — Signals + Liquidity · open full sizeFig. 8 FBTC — Delta + Technical · open full sizeFBTC — Unified OCS chart read
Executive Summary
The current state is a conflict between structural declaration and real-time participation. While Chart 1 — Signals + Liquidity maintains a 'Weakness Below' short declaration (triggering at 76.67), Chart 2 — Delta + Technical shows high-conviction bullish alignment via net buying accumulation, positive delta-force, and price action above both fast and slow liquidity lines. Currently, the price is operating within a strength regime, effectively ignoring the pending short trigger.
OCS Confluence
Grade
Directional Bias
Participation State
medium
bullish
pre-trigger
Setup Read: FBTC is exhibiting bullish delta-force and liquidity alignment despite a pending structural short declaration that remains untriggered.
Confirmations
Price is currently trading above the dominant-cycle ribbon and within a positive liquidity band (Chart 1 & Chart 2)
Momentum and Delta both indicate upward force, with Chart 1 noting a 'green strength band' and Chart 2 reporting 'net buying' and 'green delta-force arrows'.
Contradictions
Chart 1 declares a 'Weakness Below' short signal (trigger 76.67), whereas Chart 2 indicates a 'trend-continuation long' with high conviction.
Structural context in Chart 1 notes a conflict between the short declaration and the current bullish strength regime.
Levels To Watch
76.67 (Short Trigger - Chart 1)
75.67 (Short Invalidation - Chart 1)
72.67 (EMA 9 / Trend Support - Chart 2)
71.66 (T1 Target - Chart 1)
70.40 (T2 Target - Chart 1)
Invalidation
Structural failure occurs if price breaches the 75.67 stop level (Chart 1).
Risk Notes
Conflicting signals between structural declaration (short) and delta/liquidity engine (long).
Price is currently in 'open space' between the recent order block and the short trigger.
FBTC — Signals + Liquidity (click to expand)
Visible Context
Symbol
Timeframe
Layout Confidence
FBTC
1D
high
Signal Engine
Direction
Declaration
Trigger
Trigger Status
Stop / Invalidation
SHORT
Weakness Below
76.67
Not Triggered
75.67
Target Ladder
T1
T2
T3
T4
T5
Booked
Next Unbooked
71.66
70.40
69.12
N/A
N/A
None
T1 at 71.66
Structure Context
Float-Volume Zones
Momentum Band
Dominant Cycle
Price Location
Structural Context
Price is currently in open space, recently moving away from the blue secondary order block near 58.00 and gray reference zone near 57.00.
strength; price is trading within the green strength band.
bullish with steep ribbon transition visible in previous regime
Price is below the trigger (76.67) and above the stop (75.67), positioned between the trigger and T1.
The setup is conflicting as the declaration is Weakness Below, but price is currently operating within a strength regime.
Setup Read
State
R:R to T1
R:R to Furthest
Invalidation
Evidence Quality
Notes
pre-trigger
N/A
N/A
Stop at 75.67
high
The price is currently consolidating within the green strength band and above the dominant-cycle ribbon following a Weakness Below declaration that was not triggered.
FBTC — Delta + Technical (click to expand)
OCS Layout Presence
Delta Configuration Badge
Delta Histogram / CVD
Liquidity Overlay / Cycle
Ocs Ai Trader | Delta Configuration badge is visible in purple.
Green CVD columns showing net buying accumulation and green delta-force arrows are visible.
Positive liquidity band and stepped liquidity lines are visible in the main price panel.
Liquidity Engine
Active Band
Vs Slow Liquidity
Vs Fast Liquidity
Cycle State
Divergence
Hands-Off Risk
positive liquidity band with latest price in bullish zone
above slow positive liquidity line
above fast positive liquidity line
fast and slow cycle lines showing bullish alignment
none
low
Delta Engine
CVD Pressure
Dominant Cycle Leader
Adaptive Filter
Delta Force
Exhaustion Boundary
net buying
positive
bullish floor
green delta-force arrows present in recent periods
none
Secondary TA
EMA
RSI
MACD
EMA 9: 72.67, EMA 21: 70.63
RSI 14 close 63.72
MACD close 12.26, signal 2.45, histogram 9.81
Confluence
Setup Type
Directional Bias
Conviction
Confirmation
Contradiction
Key Level
trend-continuation long
bullish
high
Price is trending within a positive liquidity band, supported by a positive dominant cycle and net buying accumulation in the CVD columns.
None visible.
72.67 (EMA 21)
Fig. 9 IBIT — Signals + Liquidity · open full sizeFig. 10 IBIT — Delta + Technical · open full sizeIBIT — Unified OCS chart read
Executive Summary
The current state for IBIT is a bullish trend-continuation characterized by strong delta-force accumulation and positive liquidity alignment. While Chart 1 — Signals + Liquidity identifies a theoretical 'Weakness Below' bearish declaration, this is being aggressively rejected by the current price action, which sits above the 49.54 trigger. The strongest evidence for the bullish bias is the confluence of green CVD columns and delta-force arrows (Chart 2) paired with price trading within a green momentum band (Chart 1).
OCS Confluence
Grade
Directional Bias
Participation State
medium
bullish
active
Setup Read: IBIT exhibits strong delta-driven accumulation and momentum alignment, currently operating above a bearish signal trigger and maintaining bullish liquidity positioning.
Confirmations
Bullish momentum alignment between the green momentum band (Chart 1) and positive delta-force/CVD accumulation (Chart 2).
Price action maintains a position above key structural floors and dominant cycle ribbons in both layouts.
Chart 1 indicates a bearish structural setup that is currently being invalidated by price action, while Chart 2 shows net buying accumulation and liquidity alignment.
Levels To Watch
49.54 (Short Trigger - Chart 1)
49.34 (Invalidation Stop - Chart 1)
47.00 (Key Structural Level - Chart 2)
46.62 (T1 Target - Chart 1)
45.79 (T2 Target - Chart 1)
Invalidation
Structural failure occurs if price falls below the 49.34 stop level (Chart 1) or loses the slow positive liquidity floor (Chart 2).
Risk Notes
Conflicting signal engine declaration vs. delta strength suggests high volatility near the 49.54 level.
Potential for signal-driven volatility if the 'Weakness Below' declaration regains structural relevance.
IBIT — Signals + Liquidity (click to expand)
Visible Context
Symbol
Timeframe
Layout Confidence
IBIT: iShares Bitcoin Trust
1D
high
Signal Engine
Direction
Declaration
Trigger
Trigger Status
Stop / Invalidation
SHORT
Weakness Below
49.54
Not Triggered
49.34
Target Ladder
T1
T2
T3
T4
T5
Booked
Next Unbooked
46.62
45.79
44.95
N/A
N/A
None
N/A
Structure Context
Float-Volume Zones
Momentum Band
Dominant Cycle
Price Location
Structural Context
Price is currently in open space above the blue (above-average) and gray (average) zones.
strength; price is trading within the green momentum band.
bullish; the green ribbon is sloping upward beneath price action.
Price is above the trigger (49.54), above the stop (49.34), and above all T1-T3 targets.
The setup is conflicting as price action is trending bullishly against a bearish Weakness Below declaration.
Setup Read
State
R:R to T1
R:R to Furthest
Invalidation
Evidence Quality
Notes
unclear
N/A
N/A
Stop at 49.34
high
The setup is a Weakness Below declaration with price currently trading above the trigger and stop levels, operating within a green momentum band and above the green dominant-cycle ribbon.
IBIT — Delta + Technical (click to expand)
OCS Layout Presence
Delta Configuration Badge
Delta Histogram / CVD
Liquidity Overlay / Cycle
Ocs Ai Trader | Delta Configuration
Green CVD columns showing net buying accumulation and green delta-force arrows at the bottom
Stepped liquidity lines and shaded liquidity bands overlaying the price action
Liquidity Engine
Active Band
Vs Slow Liquidity
Vs Fast Liquidity
Cycle State
Divergence
Hands-Off Risk
positive, price is at the upper edge of the bullish zone
above slow positive liquidity line
above fast positive liquidity line
fast/slow cycle alignment (bullish)
none
low
Delta Engine
CVD Pressure
Dominant Cycle Leader
Adaptive Filter
Delta Force
Exhaustion Boundary
net buying
positive
bullish floor
recent green arrows
none
Secondary TA
EMA
RSI
MACD
EMA 12 (blue) and EMA 26 (orange) visible
RSI 14 visible
MACD (12, 26, 9) visible
Confluence
Setup Type
Directional Bias
Conviction
Confirmation
Contradiction
Key Level
trend-continuation long
bullish
high
Price is holding above the slow positive liquidity floor with a positive dominant delta cycle and recent green delta-force markers.
None visible
47.00
* **Snapshot:** IBIT Price: $47.73; FBTC Price: $73.33.
* **Analysis:** These are the primary beneficiaries of the current liquidity bifurcation. They offer institutional investors a "safe harbor" from the geopolitical volatility affecting offshore crypto venues. They are the "clean" liquidity pools of the new era.
* **Risk Note:** Monitor options volume on IBIT. The current concentration of call volume at the $48-$50 range suggests institutional positioning for a breakout, provided the macro-monetary environment (FOMC/DXY) remains supportive.
Historical Parallels
The current situation bears a striking resemblance to the 2022-2023 shift post-FTX. During that period, the market experienced a massive "flight to quality," where capital moved away from centralized, opaque exchanges and into cold storage or regulated entities. The key difference today is the sovereign actor (Russia/Digital Ruble). This is not just a market-structure crisis; it is a geopolitical one. The last time we saw such a "Financial Iron Curtain" effect was during the initial sanctions on Russian banks in 2022, which accelerated the adoption of decentralized financial rails. We are now in the "institutionalization" phase of that same trend.
Outlook & Risk Matrix
Short-Term (1-5 Days)
The market will likely remain volatile as it digests the implications of the digital ruble wage payments. Expect a "wait-and-see" approach in crypto-equities (COIN, MSTR) while spot assets (BTC, ETH) may see a bid as investors seek non-sovereign hedges.
Medium-Term (1-4 Weeks)
The primary risk is a "policy-driven divergence." If the Federal Reserve pivots to rate cuts, the regulatory risk premium on crypto will likely be ignored by institutional capital, leading to a strong rally in BTC. However, if geopolitical tensions escalate, the "Financial Iron Curtain" will solidify, potentially causing a liquidity squeeze in offshore venues.
Risk Matrix
Bull Case: Institutional ETF inflows swamp the regulatory risk premium, driving BTC to test $40k+ resistance.
Bear Case: SEC/OCC regulatory action against crypto-proxies intensifies, forcing a broader, non-discretionary sell-off in COIN and MSTR.
Base Case: A "bifurcated" market where BTC and gold (GLD) perform as neutral reserves, while crypto-native equities underperform due to compliance overhead.
What to Watch
Stablecoin De-pegging/Volume: Monitor the usage of USD-pegged stablecoins in regions with high digital ruble adoption. A significant drop in volume would confirm the "Stablecoin-to-Native" rotation thesis.
ETF Inflow Data: Any acceleration in IBIT/FBTC inflows will be the primary indicator that institutional capital is successfully insulating itself from the "shadow liquidity" crisis.
Regulatory Tone: Watch for any SEC or OCC commentary regarding the "Clarity Act" or similar legislative efforts. Any mention of "sovereign-controlled payment rails" vs. "private crypto-assets" will be the key signal for the next leg of this trend.
DXY Strength: As the dollar index fluctuates, watch for a divergence between BTC and DXY. If BTC rallies despite DXY strength, it confirms the "safe-haven" narrative.
Education and market research only, not financial advice. Charts are OCS AI Trader readings at the time of writing and change with new bars.