The Sovereign Pivot: IMF Waivers, GENIUS Act, and the New Crypto Liquidity Regime
The crypto landscape of October 2026 is undergoing a structural metamorphosis. We are moving beyond the era of speculative retail cycles into a regime defined by sovereign accounting, institutional treasury mandates, and a profound liquidity bifurcation.
The catalyst for this week’s recalibration is twofold: the International Monetary Fund’s (IMF) $138 million disbursement to El Salvador—granted via a waiver for Bitcoin accumulation limits—and the ongoing institutional absorption of the GENIUS Act’s stablecoin mandates. These events are not merely "crypto news"; they are macro-level shifts that redefine the utility of digital assets within the global financial architecture.
We are witnessing the "officialization" of Bitcoin as a sovereign-neutral reserve asset, juxtaposed against a domestic US regulatory environment that is increasingly forcing crypto-infrastructure to integrate with traditional debt markets. This report traces the cascading impacts of these developments through the four layers of our macro-research framework.
Executive Summary: The Liquidity Bifurcation
The market is currently pricing in a "dual-track" reality. On one track, Bitcoin is gaining legitimacy as a sovereign-grade asset, reducing tail risk for long-term holders and institutional vehicles like IBIT and FBTC. On the other track, crypto-native infrastructure is facing a "compliance squeeze." The stalling of the Clarity Act, combined with the appointment of former SEC chair Jay Clayton to an AI oversight role, has introduced a new layer of regulatory uncertainty that is pressuring crypto-equities like COIN.
The most critical development, however, is the "Stablecoin-Treasury" feedback loop. By mandating 1:1 T-bill backing for stablecoins, the GENIUS Act has effectively turned the crypto-native liquidity layer into a structural buyer of short-duration US debt (SHY). This creates a liquidity floor that is beginning to decouple Bitcoin from the high-beta tech correlation (NQ) that defined the 2024-2025 cycle.
Layer 1: Direct Impacts (The Catalyst)
The immediate market impact is driven by two distinct regulatory vectors:
Sovereign Validation: The IMF’s waiver for El Salvador is the first major instance of a global financial institution implicitly accepting a Bitcoin-backed fiscal policy. This reduces the "sovereign risk" premium that has historically plagued BTC. For institutional investors, this shifts the narrative from "speculative asset" to "state-sanctioned reserve."
Regulatory Friction: The appointment of Jay Clayton to lead the Super Intelligence Force (SIF) has created short-term volatility in crypto-equities. Markets are interpreting this as a potential "regulatory convergence"—where AI and crypto oversight are bundled, increasing the compliance burden for firms like Coinbase (COIN) and MicroStrategy (MSTR).
Global Compliance Scrutiny: Japan’s sanctioning of Garantex highlights the tightening of the global "compliance net." While this restricts illicit flows, it also reinforces the "compliance moat" around regulated ETFs (IBIT, FBTC), effectively forcing global capital toward sanctioned, transparent on-ramps.
Layer 2: Secondary Effects (The Mechanics)
The direct impacts are creating significant knock-on effects within the crypto-ecosystem:
The T-Bill Bid: The GENIUS Act’s mandate for stablecoin reserves is creating a massive, persistent bid for short-term US Treasuries (SHY). This is not just a regulatory hurdle; it is a fundamental change in the stablecoin business model. Issuers are now, effectively, shadow-banks for the US government.
Yield Compression: As regulated stablecoins become the industry standard, the "crypto-native yield" (DeFi lending rates) is compressing. Investors are finding that the risk-free rate on-chain is converging with the risk-free rate in the traditional banking system. This is forcing a rotation: capital is leaving "yield-farming" and moving into higher-beta, non-compliant assets to chase returns, or into spot ETFs for safety.
Institutional Arbitrage: The "dual-track" framework—IMF sovereign legitimacy + GENIUS Act compliance—is narrowing bid-ask spreads for spot ETFs. Market makers are finding it easier to hedge and arbitrage these instruments, which is reducing the volatility premium and increasing liquidity depth for IBIT and FBTC.
Layer 3: Macro Propagation (The Ripples)
These effects are now propagating into the broader macro environment:
Sovereign De-Dollarization Hedge: Countries with weak fiscal profiles are looking at the El Salvador model. This creates a "sovereign contagion" risk. If multiple EM nations attempt to mimic this strategy, we could see a structural rotation from traditional FX reserves into BTC. This puts BTC in direct competition with Gold (GLD) as a neutral safe-haven asset, potentially pressuring the DXY in the long term.
EM Credit Contagion: Conversely, the market is punishing EM nations that attempt to adopt BTC without the fiscal discipline to back it. We are seeing a "flight to quality" where capital flees EM equities (NIFTY, SENSEX) in favor of US-regulated crypto assets. This is creating a localized liquidity squeeze in emerging markets.
The "Hard" Asset Rotation: We are observing a divergence. Capital is rotating away from non-compliant alt-coins and toward regulated, reserve-backed assets. The market is effectively pricing in a "regulatory survival premium" for BTC and ETH, while assets lacking clear legal standing are seeing liquidity evaporate.
Layer 4: Non-Obvious Connections (Hidden Risks)
This is where the analysis diverges from consensus:
The Stablecoin-Treasury Feedback Loop: Most analysts view stablecoins as a volatility driver. We view them as a volatility dampener. Because stablecoins are now mandated to hold SHY, they act as a synthetic buyer of US front-end rates. This provides a liquidity floor for the entire crypto ecosystem. In a risk-off event, the stablecoin mechanism forces the purchase of Treasuries, which supports the base layer of the crypto market, potentially decoupling BTC from the Nasdaq (NQ) correlation.
The Semiconductor-Crypto Divergence: The "AI-crypto intersection" is becoming a trap. As regulatory scrutiny of crypto service providers increases (via the Clayton-led SIF), capital is rotating out of speculative AI-crypto projects and into pure-play AI hardware (NVDA). This is creating a bifurcated risk-on environment: you can play the AI/compute boom through hardware, or the "sovereign reserve" boom through BTC, but the middle ground is becoming toxic.
Institutional Arbitrage Compression: The "crypto-premium" on Coinbase (COIN) is eroding. As spot ETFs (IBIT/FBTC) capture the institutional flow, COIN is being re-rated from a "high-beta crypto proxy" to a "regulated financial infrastructure play." This implies lower volatility, but also lower upside potential during bull runs.
Unified OCS Chart Read
Note: OCS chart capture is currently deferred to the async repair queue. The following analysis is derived from provided technical indicators and market data.
BTC (Price $37.25): The technical setup is neutral-to-bullish. With RSI at 63.71 and the price trading near the Bollinger Upper band (39.05), the asset is approaching a short-term resistance cluster. The MACD is tight, suggesting a lack of directional conviction in the immediate term.
COIN (Price $183.00): The setup is cautious. RSI at 49.37 indicates a neutral stance. The MACD histogram (-1.27) suggests waning momentum. The asset is trading below its 20-day SMA (185.86), marking a potential "hands-off" zone until it can reclaim the 190+ level.
IBIT (Price $47.73): Similar to BTC, the RSI at 63.77 indicates strength, but the MACD histogram (-0.1) suggests the recent rally is losing steam. The setup confirms the "institutional consolidation" thesis—the asset is stable, but awaiting a fresh catalyst to break the $49.39 resistance.
Conclusion: The charts confirm a "consolidation phase." The market is processing the IMF/GENIUS Act news. We are not seeing a parabolic breakout, but rather a structural accumulation at current levels.
Security-by-Security Analysis
BTC (Bitcoin)
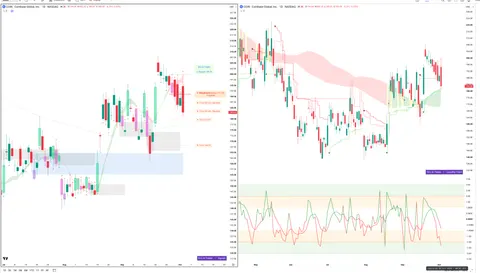
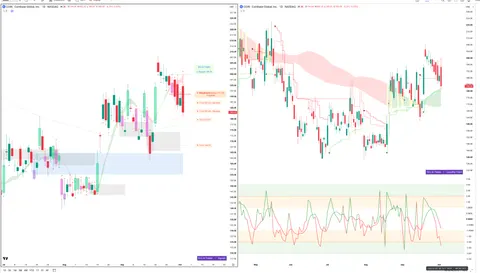
Fig. 1 COIN — Signals + Liquidity · open full sizeFig. 2 COIN — Delta + Technical · open full sizeCOIN — Unified OCS chart read
Executive Summary
The asset is currently in a state of heavy structural conflict. Chart 1 — Signals + Liquidity identifies a bearish regime characterized by price rejection at the pink extreme float-volume zone and negative cycle pressure, targeting 168.25. Conversely, Chart 2 — Delta + Technical shows strong bullish participation, with net buying CVD pressure and price trending above both fast and slow positive liquidity lines.
OCS Confluence
Grade
Directional Bias
Participation State
low
neutral
unclear
Setup Read: COIN is exhibiting a high-tension divergence between bearish momentum/cycle structure and bullish delta-force/liquidity participation.
Confirmations
Price is currently situated within a high-volume resistance zone near 200-210 (Chart 1 — Signals + Liquidity)
Structural regime is shifting between bearish momentum and bullish delta-force support
Contradictions
Chart 1 — Signals + Liquidity declares a 'Weakness Below' bearish short setup, while Chart 2 — Delta + Technical shows high-conviction bullish trend-continuation via net buying and positive liquidity bands.
Structural failure of the bearish regime occurs if price breaches 199.75 (Chart 1 — Signals + Liquidity).
Risk Notes
Significant divergence between momentum regime (bearish) and delta/liquidity (bullish)
Price is currently trapped between the bearish stop (199.75) and the bullish trend-continuation floor (188.00)
Potential for high-volatility chop within the current liquidity-momentum conflict zone
COIN — Signals + Liquidity (click to expand)
Visible Context
Symbol
Timeframe
Layout Confidence
COIN
1D
high
Signal Engine
Direction
Declaration
Trigger
Trigger Status
Stop / Invalidation
SHORT
Weakness Below
181.05
Triggered
199.75
Target Ladder
T1
T2
T3
T4
T5
Booked
Next Unbooked
181.05
183.48
179.67
168.25
N/A
T1, T2, T3
T4 at 168.25
Structure Context
Float-Volume Zones
Momentum Band
Dominant Cycle
Price Location
Structural Context
Price is rejecting the pink extreme float-volume zone near 200-210.
weakness; price is trading within the pink momentum weakness band.
bearish; pink ribbon indicates active negative cycle pressure.
Price is currently at 194.44, above the trigger (181.05) and historical targets, but below the stop (199.75) and within the pink resistance zone.
The setup is clean as price is conforming to the pink weakness regime across momentum, cycle, and float-volume layers.
Setup Read
State
R:R to T1
R:R to Furthest
Invalidation
Evidence Quality
Notes
active
N/A
N/A
Stop at 199.75 or structural invalidation of the Weakness Below declaration.
high
Price is currently rejecting the pink extreme float-volume zone while sitting within a pink weakness momentum band and a pink negative cycle ribbon.
COIN — Delta + Technical (click to expand)
OCS Layout Presence
Delta Configuration Badge
Delta Histogram / CVD
Liquidity Overlay / Cycle
Ocs Ai Trader | Delta Configuration badge visible in the middle pane
Green and red CVD columns visible in the bottom pane with green delta-force arrows at the base
Positive (green) and negative (red) liquidity bands and stepped cycle lines visible on the main price pane
Liquidity Engine
Active Band
Vs Slow Liquidity
Vs Fast Liquidity
Cycle State
Divergence
Hands-Off Risk
positive liquidity band with latest price near the upper boundary
above slow positive line
above fast positive line
fast and slow cycle alignment (bullish)
none
low
Delta Engine
CVD Pressure
Dominant Cycle Leader
Adaptive Filter
Delta Force
Exhaustion Boundary
net buying
positive
bullish floor
recent green arrows
none
Secondary TA
EMA
RSI
MACD
EMA 20: 188.65, EMA 50: 185.65
RSI 14: 49.45
MACD line 12 26 9: -1.31, Signal line: 4.32, Histogram: 5.63
Confluence
Setup Type
Directional Bias
Conviction
Confirmation
Contradiction
Key Level
trend-continuation long
bullish
high
Price is trending above the slow positive liquidity line within a positive liquidity band, supported by green CVD columns and recent green delta-force arrows.
None visible.
188.00
Fig. 3 BTC — Signals + Liquidity · open full sizeFig. 4 BTC — Delta + Technical · open full sizeBTC — Unified OCS chart read
Executive Summary
The consensus outlook is bullish, characterized by a pre-trigger participation state. While Chart 1 — Signals + Liquidity defines a 'Strength Above' long declaration awaiting a trigger at 86,773, Chart 2 — Delta + Technical provides high-conviction force confirmation through net buying accumulation and positive liquidity band alignment.
OCS Confluence
Grade
Directional Bias
Participation State
high
bullish
pre-trigger
Setup Read: BTC maintains bullish structural integrity within a positive liquidity cycle, awaiting a specific participation trigger at 86,773 to formalize the strength declaration.
Confirmations
Bullish momentum alignment: Chart 1 identifies price inside a green momentum band while Chart 2 shows net buying accumulation via green CVD columns.
Trend-continuation structure: Chart 1 reports a bullish dominant cycle with price above the green ribbon, while Chart 2 confirms a positive liquidity cycle with fast/slow lines in alignment.
Absence of exhaustion: Both charts report no visible exhaustion boundaries or contradictions.
Structural failure occurs if price falls below the stop level of 84,251 (Chart 1 — Signals + Liquidity).
Risk Notes
Participation is currently pre-trigger, meaning the signal engine declaration has not yet been activated by price action.
Approaching red extreme zone at 88,000 (Chart 1) may increase the probability of localized exhaustion.
BTC — Signals + Liquidity (click to expand)
Visible Context
Symbol
Timeframe
Layout Confidence
BTCUSDT: Bitcoin / U.S. Dollar 1D: Bitstamp
1D
high
Signal Engine
Direction
Declaration
Trigger
Trigger Status
Stop / Invalidation
LONG
Strength Above
86773
Not Triggered
84251
Target Ladder
T1
T2
T3
T4
T5
Booked
Next Unbooked
86901
87691
N/A
N/A
N/A
None
88000
Structure Context
Float-Volume Zones
Momentum Band
Dominant Cycle
Price Location
Structural Context
Price is currently in open space, having recently broken above a blue secondary order block zone (near 85000) and is approaching the red extreme zone (88000)
strength; price is trading inside the green momentum strength band
bullish; green ribbon is trending upward with price maintaining support above it
Price is between the trigger (86773) and the first target (86901), currently above the stop (84251)
The setup is clean with multiple layers of confluence including momentum bands, dominant cycle support, and a recent breakout from blue volume zones.
Setup Read
State
R:R to T1
R:R to Furthest
Invalidation
Evidence Quality
Notes
pre-trigger
N/A
N/A
Stop at 84251
high
Price is currently trading within a green momentum strength band and above the dominant-cycle green ribbon, following a 'Strength Above' declaration where the trigger at 86773 remains Not Triggered.
BTC — Delta + Technical (click to expand)
OCS Layout Presence
Delta Configuration Badge
Delta Histogram / CVD
Liquidity Overlay / Cycle
Ocs Ai Trader | Delta Configuration
Green CVD columns indicating net buying accumulation with green delta-force arrows at the bottom
Visible positive liquidity bands (green) and liquidity cycle lines overlaid on price
Liquidity Engine
Active Band
Vs Slow Liquidity
Vs Fast Liquidity
Cycle State
Divergence
Hands-Off Risk
positive liquidity band, price is currently within the upper bounds of the band
above slow positive liquidity line
above fast positive liquidity line
fast and slow liquidity lines are in a positive alignment/cycle
none
low
Delta Engine
CVD Pressure
Dominant Cycle Leader
Adaptive Filter
Delta Force
Exhaustion Boundary
net buying
positive
bullish floor
recent green arrows
none
Secondary TA
EMA
RSI
MACD
EMA 21 close is 83,254
RSI 14 close is 67.74
MACD close 12 26 9 is 2,042
Confluence
Setup Type
Directional Bias
Conviction
Confirmation
Contradiction
Key Level
trend-continuation long
bullish
medium
Price is currently trading within a positive liquidity band with green CVD columns indicating net buying accumulation.
None visible.
86,495
* **Status:** Sovereign-backed reserve asset.
* **Analysis:** The IMF waiver is the fundamental floor. The current price ($37.25) is consolidating. Watch for the $39.05 Bollinger resistance. If broken, the path to $40k+ is cleared.
* **Risk:** Regulatory noise regarding the "Super Intelligence Force" could induce short-term volatility.
COIN (Coinbase)
Status: Infrastructure play undergoing re-rating.
Analysis: Trading at $183.00, COIN is caught between the "compliance moat" and the "regulatory uncertainty" of the Clayton appointment. It is no longer moving in lockstep with BTC.
Levels: Support at $164.38 (Bollinger Lower). Resistance at $207.34 (Bollinger Upper).
IBIT / FBTC
Fig. 5 FBTC — Signals + Liquidity · open full sizeFig. 6 FBTC — Delta + Technical · open full sizeFBTC — Unified OCS chart read
Executive Summary
The asset is currently caught in a high-conviction divergence between structural momentum and active participant flow. While Chart 1 — Signals + Liquidity identifies a bearish structural setup due to rejection of the 75.87 extreme float-volume zone and a pink momentum band, Chart 2 — Delta + Technical shows aggressive net buying pressure, positive delta-force arrows, and price holding above bullish liquidity lines. The market is in a state of tension between structural weakness and delta-driven accumulation.
OCS Confluence
Grade
Directional Bias
Participation State
low
neutral
pre-trigger
Setup Read: FBTC exhibits a significant divergence between bearish structural momentum signals and bullish delta-driven liquidity accumulation.
Confirmations
Price is operating within a high-volatility zone characterized by extreme float-volume rejection (Chart 1) and positive delta-force accumulation (Chart 2).
Structural tension exists between the bearish momentum ribbon (Chart 1) and the bullish liquidity/delta alignment (Chart 2).
Contradictions
Chart 1 — Signals + Liquidity declares a bearish 'Weakness Below' setup with a short trigger at 75.87.
Chart 2 — Delta + Technical declares a bullish 'trend-continuation long' with high conviction based on positive CVD and liquidity alignment.
Levels To Watch
75.87: Short Trigger / Float-Volume Zone (Chart 1)
73.67: Structural Invalidation (Chart 1)
72.97: Key Bullish Confluence Level (Chart 2)
71.66: Bearish Target T1 (Chart 1)
70.63: EMA 21 Support (Chart 2)
Invalidation
Structural failure occurs if price closes above the 75.87 rejection zone (Chart 1) or breaches the slow positive liquidity line (Chart 2).
Risk Notes
High-impact divergence between momentum and delta engines.
Potential for whip-saw action around the 75.87 float-volume zone.
Risk of momentum-driven exhaustion if delta pressure fails to hold liquidity levels.
FBTC — Signals + Liquidity (click to expand)
Visible Context
Symbol
Timeframe
Layout Confidence
FBTC
1D
high
Signal Engine
Direction
Declaration
Trigger
Trigger Status
Stop / Invalidation
SHORT
Weakness Below
75.87
Not Triggered
73.67
Target Ladder
T1
T2
T3
T4
T5
Booked
Next Unbooked
71.66
70.40
69.12
N/A
N/A
None
N/A
Structure Context
Float-Volume Zones
Momentum Band
Dominant Cycle
Price Location
Structural Context
Price is rejecting a pink extreme float-volume zone at 75.87/76.00.
weakness (price is inside the pink momentum band)
bearish (pink ribbon active)
Price is below the trigger of 75.87 and approaching the T1 target of 71.66.
The setup is clean due to triple-confluence of pink weakness bands, pink cycle ribbon, and pink float-volume zone rejection.
Setup Read
State
R:R to T1
R:R to Furthest
Invalidation
Evidence Quality
Notes
pre-trigger
N/A
N/A
Stop at 73.67
high
Price is rejecting a pink extreme float-volume zone while positioned within a pink weakness momentum band and a pink dominant-cycle ribbon.
FBTC — Delta + Technical (click to expand)
OCS Layout Presence
Delta Configuration Badge
Delta Histogram / CVD
Liquidity Overlay / Cycle
Ocs Ai Trader | Delta Configuration
Green and red CVD columns with green delta-force arrows and green/red triangles on the volume axis.
Visible liquidity bands (shaded green/red zones) and stepped liquidity lines overlaying the price action.
Liquidity Engine
Active Band
Vs Slow Liquidity
Vs Fast Liquidity
Cycle State
Divergence
Hands-Off Risk
positive, with price currently in the bullish zone near the upper boundary
above slow positive line
above fast positive line
fast/slow cycle alignment (bullish)
none
low
Delta Engine
CVD Pressure
Dominant Cycle Leader
Adaptive Filter
Delta Force
Exhaustion Boundary
net buying
positive
bullish floor
recent green arrows
none
Secondary TA
EMA
RSI
MACD
EMA 9: 72.67, EMA 21: 70.63
RSI 14 close: 63.72, 63.13
MACD close 12.26, -0.1568, 2.45
Confluence
Setup Type
Directional Bias
Conviction
Confirmation
Contradiction
Key Level
trend-continuation long
bullish
high
Price is holding above the slow positive liquidity line with positive delta-force arrows and green CVD accumulation columns.
None visible.
72.97
Fig. 7 IBIT — Signals + Liquidity · open full sizeFig. 8 IBIT — Delta + Technical · open full sizeIBIT — Unified OCS chart read
Executive Summary
The consensus outlook for IBIT is bullish trend-continuation, driven by strong participation and structural alignment. While Chart 1 — Signals + Liquidity notes a conflicting short declaration that has been bypassed, Chart 2 — Delta + Technical confirms high-conviction bullishness through net buying CVD pressure and price holding above both fast and slow positive liquidity lines. The current state is characterized by momentum interacting with the upper boundaries of the strength band.
OCS Confluence
Grade
Directional Bias
Participation State
high
bullish
active
Setup Read: IBIT exhibits an active bullish trend-continuation profile as price maintains strength above the structural trigger and positive liquidity zones.
Confirmations
Price is maintaining a bullish posture above the key 47.00 level (Chart 2) and above the 49.34 trigger zone (Chart 1).
Both charts indicate a positive momentum/cycle environment, with Chart 1 showing a steep ribbon transition and Chart 2 showing aligned fast/slow liquidity cycles.
Volume/Delta support is present; Chart 2 reports net buying and positive delta-force arrows while Chart 1 notes price is in a strength regime.
Contradictions
Chart 1 identifies a 'SHORT' declaration for 'Weakness Below' at 49.34, but notes the setup is currently conflicting as price has moved above the trigger.
Levels To Watch
49.34: Weakness Below Trigger (Chart 1)
47.00: Key Confluence Level (Chart 2)
46.62: T1 Target (Chart 1)
47.33: EMA 1 Close (Chart 2)
Invalidation
Structural failure is defined by a close below the 49.34 trigger level (Chart 1).
Risk Notes
Conflicting signal regime due to price breaching the initial weakness trigger (Chart 1).
Potential for exhaustion if price reaches the upper boundary of the momentum strength band (Chart 1).
IBIT — Signals + Liquidity (click to expand)
Visible Context
Symbol
Timeframe
Layout Confidence
IBIT : iShares Bitcoin Trust : NASDAQ
1D
high
Signal Engine
Direction
Declaration
Trigger
Trigger Status
Stop / Invalidation
SHORT
Weakness Below
49.34
Not Triggered
49.34
Target Ladder
T1
T2
T3
T4
T5
Booked
Next Unbooked
46.62
45.79
44.95
N/A
N/A
None
T1 at 46.62
Structure Context
Float-Volume Zones
Momentum Band
Dominant Cycle
Price Location
Structural Context
Price is currently in open space above the red/pink extreme zone (47.47 - 49.04).
strength with price interacting with the upper boundary of the green strength band.
bullish with steep ribbon transition
Price is above the trigger (49.34) and currently trading between the trigger and T1 (46.62).
The setup is conflicting because price has moved above the Weakness Below trigger and is trading within a strength regime.
Setup Read
State
R:R to T1
R:R to Furthest
Invalidation
Evidence Quality
Notes
active
N/A
N/A
Stop at 49.34
high
Price is currently breaking above the Weakness Below declaration zone, moving toward the next unbooked target with momentum band and cycle alignment.
IBIT — Delta + Technical (click to expand)
OCS Layout Presence
Delta Configuration Badge
Delta Histogram / CVD
Liquidity Overlay / Cycle
Ocs Ai Trader | Delta Configuration
green and red CVD columns with green delta-force arrows at the bottom
stepped liquidity lines and colored liquidity bands (positive/green, uncertain/blue, negative/red) overlaid on price
Liquidity Engine
Active Band
Vs Slow Liquidity
Vs Fast Liquidity
Cycle State
Divergence
Hands-Off Risk
positive, price is currently in the positive liquidity zone
above slow positive line
above fast positive line
fast/slow cycle alignment (both positive)
none
low
Delta Engine
CVD Pressure
Dominant Cycle Leader
Adaptive Filter
Delta Force
Exhaustion Boundary
net buying
positive
bullish floor
recent green arrows
none
Secondary TA
EMA
RSI
MACD
EMA 1 close: 47.33, EMA 1 close: 46.00
RSI 14 close: 64.66 55.73
MACD 12 26 9: -0.1007 1.60 1.70
Confluence
Setup Type
Directional Bias
Conviction
Confirmation
Contradiction
Key Level
trend-continuation long
bullish
high
Price is holding above the slow positive liquidity line with positive CVD columns and a positive dominant delta cycle.
None visible.
47.00
* **Status:** Institutional liquidity vehicles.
* **Analysis:** These are the primary beneficiaries of the "dual-track" regulatory framework. They are seeing consistent volume ($48.5M for IBIT on Oct 2nd). They are the "safe harbor" for institutional capital.
* **Risk:** Limited, primarily tracking BTC spot volatility.
SHY (Short-Term Treasuries)
Fig. 9 SHY — Signals + Liquidity · open full sizeFig. 10 SHY — Delta + Technical · open full sizeSHY — Unified OCS chart read
Executive Summary
The consensus view for SHY is a bearish trend-continuation characterized by high conviction but significant exhaustion. While Chart 1 — Signals + Liquidity notes that all declared short targets have been historically booked, Chart 2 — Delta + Technical confirms active selling pressure with red CVD columns and price trading below both fast and slow negative liquidity lines. The current state is one of downward momentum seeking a new structural floor below the 81.00 level.
OCS Confluence
Grade
Directional Bias
Participation State
high
bearish
exhausted
Setup Read: SHY exhibits a high-conviction bearish trend with all primary targets booked, currently navigating a negative liquidity band and momentum weakness regime.
Confirmations
Bearish structural alignment: Chart 1 identifies a negative cycle ribbon while Chart 2 confirms negative dominant delta cycles.
Price location: Both charts locate price within weakness regimes (Chart 1's pink momentum weakness band and Chart 2's negative liquidity band).
Momentum Profile: Chart 1 notes weakness below 81.88, while Chart 2 confirms net selling via red CVD columns and delta-force arrows.
Structural failure occurs if price breaches the 82.20 level (Chart 1 — Signals + Liquidity).
Risk Notes
Setup exhaustion: All declared targets from the Weakness Below declaration have been met (Chart 1 — Signals + Liquidity).
Low hands-off risk: Alignment of liquidity and delta cycles suggests high-quality bearish continuation (Chart 2 — Delta + Technical).
SHY — Signals + Liquidity (click to expand)
Visible Context
Symbol
Timeframe
Layout Confidence
SHY
1D
high
Signal Engine
Direction
Declaration
Trigger
Trigger Status
Stop / Invalidation
SHORT
Weakness Below
81.88
Triggered
82.20
Target Ladder
T1
T2
T3
T4
T5
Booked
Next Unbooked
81.79 (Booked)
81.71 (Booked)
81.62 (Booked)
81.57 (Booked)
81.21 (Booked)
T1, T2, T3, T4, T5
all booked
Structure Context
Float-Volume Zones
Momentum Band
Dominant Cycle
Price Location
Structural Context
Price is rejecting a pink extreme float-volume zone at 82.20
weakness; price is oscillating within the pink momentum weakness band
bearish; price is trending within a pink negative cycle ribbon
Price is currently below all booked targets and the trigger, trending within the weakness regime
The setup is exhausted as all declared targets have been historically booked.
Setup Read
State
R:R to T1
R:R to Furthest
Invalidation
Evidence Quality
Notes
exhausted
N/A
N/A
Price above 82.20 stop
high
The setup follows a Weakness Below declaration where all five targets have been booked, currently navigating a pink momentum weakness band and pink cycle pressure.
SHY — Delta + Technical (click to expand)
OCS Layout Presence
Delta Configuration Badge
Delta Histogram / CVD
Liquidity Overlay / Cycle
Ocs Ai Trader | Delta Configuration
red CVD columns and red delta-force arrows
negative liquidity band and stepped liquidity lines
Liquidity Engine
Active Band
Vs Slow Liquidity
Vs Fast Liquidity
Cycle State
Divergence
Hands-Off Risk
negative, with latest price at 81.00
below slow negative liquidity line
below fast negative liquidity line
fast/slow cycle alignment
none
low
Delta Engine
CVD Pressure
Dominant Cycle Leader
Adaptive Filter
Delta Force
Exhaustion Boundary
net selling
negative
bearish ceiling
red delta-force arrows
none
Secondary TA
EMA
RSI
MACD
EMA 11 (81.16) and EMA 21 (81.33)
RSI 14 close (34.83)
MACD 12 26 9 (-0.0011, -0.1742, -0.1731)
Confluence
Setup Type
Directional Bias
Conviction
Confirmation
Contradiction
Key Level
trend-continuation short
bearish
high
Price is trending within a negative liquidity band supported by negative dominant delta cycles.
None visible
81.00
* **Status:** The "Hidden" beneficiary.
* **Analysis:** As stablecoin reserve mandates kick in, SHY becomes a proxy for crypto-liquidity. If crypto volumes explode, SHY demand increases, potentially suppressing its yield.
Historical Parallels
The current "Sovereign Adoption + Regulatory Mandate" combination is unique, but we can draw parallels to the early days of Gold ETFs (2004). When Gold was first institutionalized via GLD, it transitioned from a "fringe commodity" to a "portfolio staple." We are seeing the same transition for BTC via IBIT/FBTC. The El Salvador IMF waiver is the "Basel III" moment for Bitcoin—it moves the asset from the "speculative" column to the "reserve" column in the accounting ledgers of nations.
Outlook & Risk Matrix
Short-Term (1-5 Days):
Base Case: Consolidation. The market digests the IMF news and the Clayton appointment. Expect range-bound trading in BTC between $36k and $39k.
Bull Case: A breakthrough of the $39k resistance, driven by ETF inflows, as the market realizes the "sovereign risk" of BTC has been effectively neutralized by the IMF.
Bear Case: A "regulatory shock" from the SIF (Super Intelligence Force) regarding crypto-AI integration, causing a temporary liquidity drain from COIN and MSTR.
Medium-Term (1-4 Weeks):
Key Driver: The implementation of the GENIUS Act. Watch for announcements on stablecoin reserve audits. This will reveal the true scale of the "T-bill bid."
Risk: EM contagion. If a second, more fiscally unstable nation attempts to adopt BTC, expect a sharp, negative reaction in their sovereign debt markets, which could spill over into global risk assets.
What to Watch
Stablecoin Reserve Audits: Any sign of "reserve slippage" will trigger a massive volatility event.
Clayton/SIF Announcements: Watch for the first policy guidance from the new Super Intelligence Force. If they target "AI-crypto intersections," expect a sector-wide sell-off in speculative AI-tokens.
DXY vs. BTC Correlation: If the DXY strengthens and BTC holds its value (or rises), the "de-dollarization" thesis is confirmed. If BTC falls with DXY strength, the "speculative tech" correlation remains intact.
Education and market research only, not financial advice. Charts are OCS AI Trader readings at the time of writing and change with new bars.