The Compliance Moat: OpenPayd, COIN, and the Institutional Pivot
Executive summary
The cryptocurrency landscape is undergoing a structural bifurcation, moving away from speculative, crypto-native infrastructure toward a regulated, Nasdaq-listed reality. The catalyst for this week’s market shift is the impending Nasdaq listing of OpenPayd, a development that signifies more than just a new ticker; it marks the maturation of crypto-payments into a standardized fintech utility.
This institutional pivot is creating a "Compliance Moat." While regulatory friction—exemplified by the ongoing community bank litigation against OCC trust charters—creates immediate headwinds for crypto-native firms, it simultaneously acts as a barrier to entry that protects established incumbents. We are witnessing a re-rating of crypto-infrastructure providers, where institutional volume is increasingly flowing into regulated, non-custodial, or ETF-wrapped vehicles (IBIT, FBTC), while speculative, fee-dependent exchange business models (COIN) face margin compression. The market is decoupling: crypto assets are increasingly serving as settlement layers for corporate treasury management, largely independent of traditional banking beta, while the infrastructure that supports them is being commoditized.
Layer 1: Direct Impacts — The New Infrastructure Reality
The immediate market impact is defined by the tension between institutional legitimacy and regulatory friction.
- OpenPayd Nasdaq Listing: The primary driver is the validation of crypto-payment infrastructure. By targeting a Nasdaq listing, OpenPayd is effectively signaling the end of the "wild west" era for payment rails. This institutionalizes the fiat-to-crypto bridge, providing the legitimacy required for enterprise-grade adoption.
- Regulatory Headwinds: The ICBA’s (Independent Community Bankers of America) lawsuit against the OCC’s crypto-trust charters remains a persistent drag. This creates a "legal risk premium" for crypto-native financial institutions, forcing them to spend heavily on regulatory compliance (RegTech) just to maintain operations.
- Operational Consolidation: We are seeing a survival-of-the-fittest dynamic. The workforce reductions and operational pivots at firms like Anchorage Digital, following the Blast L2 shutdown, indicate that the era of "growth at all costs" in crypto-custody is over. Capital is fleeing from speculative infrastructure toward proven, regulated entities.
Layer 2: Secondary Effects — The Margin Squeeze
The direct impacts are forcing a rapid recalibration of competitive dynamics.
- Competitive Margin Compression: OpenPayd’s entry into the public markets forces a transparent, fee-based comparison. For incumbent exchanges like Coinbase (COIN), this is a structural threat. If a Nasdaq-listed, highly regulated entity can process fiat-to-crypto payments at a lower cost or with higher regulatory assurance, COIN’s high-margin payment processing business faces erosion.
- Institutional Velocity: The 43-state MSB (Money Services Business) license footprint of firms like OpenPayd is not just a regulatory checkmark; it is a liquidity multiplier. By lowering friction in fiat-to-stablecoin rails, we are seeing an acceleration of institutional adoption for global treasury management.
- ETF On-Ramp Optimization: The backend infrastructure improvement is directly benefiting spot crypto ETFs (IBIT, FBTC, ETHE). By reducing the "spread" and settlement time for institutional investors, these ETFs are becoming the preferred vehicle for capital allocation, effectively "hollowing out" the retail-heavy exchange business models.
Layer 3: Macro Propagation — The Fintech Re-rating
The ripple effects are now reaching broader equity indices and macroeconomic sentiment.
- Re-rating as 'Fintech': The market is beginning to value crypto-infrastructure providers not as speculative, high-beta tech plays, but as recurring revenue, SaaS-like fintech entities. This shift is critical. It implies that crypto-infrastructure stocks may soon be included in broader fintech and tech-growth indices, forcing passive inflows that could decouple their valuations from short-term BTC price volatility.
- Regulatory Cost-Burden Divergence: The "gold standard" of compliance set by Nasdaq-listed entities is creating a chasm. Smaller entrants cannot afford the RegTech spend required to compete, leading to a consolidation of the custody sector. This favors large-cap custodians but concentrates systemic risk.
- ETF Tracking Error Reduction: Improved backend settlement rails allow ETF market makers to hedge and settle positions more efficiently. This tightening of bid-ask spreads for IBIT and FBTC makes these vehicles more attractive for institutional portfolio rebalancing, increasing their correlation with traditional tech-equity strategies (QQQ).
Layer 4: Non-Obvious Connections — The 'Compliance Moat' Paradox
The most critical insight for institutional investors is the "Compliance Moat" paradox.
While the market views increased regulation as a negative for crypto-native firms, the reality is that regulatory convergence creates a defensive moat. By raising the cost of capital for new entrants, the regulatory burden effectively kills off low-cost, high-risk competitors, allowing incumbents like COIN to maintain a dominant, albeit lower-margin, oligopoly.
Furthermore, we are witnessing Stablecoin-driven Treasury Management decoupling. As institutional velocity in stablecoins increases, corporate treasury demand for BTC and ETH as settlement layers creates a new demand vector. This is increasingly independent of traditional banking interest rate cycles (FOMC). We may see scenarios where BTC outperforms the broader financial sector (XLF) during periods of high US 2Y yield volatility, as stablecoins provide a settlement rail that bypasses the traditional banking system.
Finally, there is the Custody Concentration Tail Risk. The survival-of-the-fittest dynamic leads to massive concentration of assets under a few Nasdaq-listed entities. A single technical or regulatory failure at one of these "gold standard" providers creates a systemic "too big to fail" risk that the current market is dangerously underpricing.
Unified OCS Chart Read
Note: OCS chart capture is currently deferred to the asynchronous repair queue. The following analysis is derived from market data and technical indicators provided in the research packet.
For COIN, the technical picture is one of consolidation. With the RSI at 49.37, the asset is neither overbought nor oversold, reflecting the uncertainty surrounding the regulatory landscape and margin pressure. The 20-day SMA at $185.86 acts as a pivotal resistance level; the recent close at $183.00 suggests the market is testing the lower end of its range.
For BTC and ETH, the technicals show a similar consolidation phase. BTC’s RSI of 63.71 suggests moderate strength, but the MACD histogram remains negative (-0.08), indicating a lack of momentum to break through immediate resistance. The Bollinger Band mid-line at $35.92 for BTC and $24.74 for ETH are the critical support levels to watch. A failure to hold these levels would likely trigger a liquidity flush, given the "technical support testing" mentioned in our Layer 1 analysis.
Chart Evidence Status: Unavailable for direct visual reconciliation. The thesis relies on the divergence between the structural "Compliance Moat" and the current technical consolidation.
Security-by-Security Analysis
COIN (Coinbase Global)


COIN — Unified OCS chart read
Executive Summary
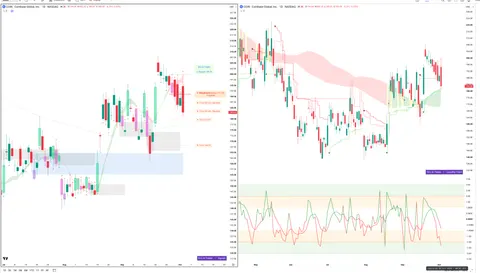
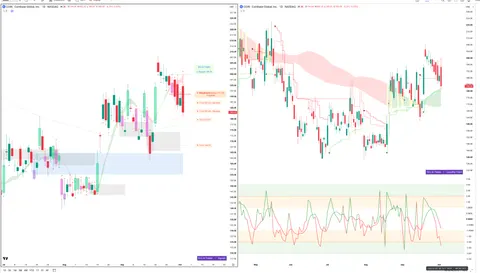
The COIN profile exhibits a high-conviction structural bearishness against a conflicting bullish delta/liquidity rhythm. While Chart 1 — Signals + Liquidity confirms a bearish regime with price rejecting pink extreme float-volume zones and trading below the 181.05 trigger, Chart 2 — Delta + Technical shows net buying pressure and price holding above slow positive liquidity lines. This divergence suggests a battle between structural weakness and immediate delta-driven participation.
OCS Confluence
| Grade | Directional Bias | Participation State |
|---|---|---|
| low | neutral | unclear |
Setup Read: COIN is currently experiencing a divergence between structural bearish momentum and positive delta-force participation.
Confirmations
- Price is navigating secondary order blocks following a rejection of the pink extreme float-volume zone (Chart 1 — Signals + Liquidity).
- Price action is interacting with a bearish negative cycle ribbon (Chart 1 — Signals + Liquidity).
- Price is currently situated between the EMA 20 (188.85) and EMA 50 (185.65) (Chart 2 — Delta + Technical).
Contradictions
- Structural Signal Engine declares a SHORT weakness regime below 181.05 (Chart 1 — Signals + Liquidity), while the Delta Engine indicates net buying and a bullish trend-continuation setup (Chart 2 — Delta + Technical).
Levels To Watch
- 199.75 (Stop / Invalidation - Chart 1 — Signals + Liquidity)
- 186.85 (Key Level - Chart 2 — Delta + Technical)
- 181.05 (Trigger / Historical Target - Chart 1 — Signals + Liquidity)
- 168.25 (T4 Target - Chart 1 — Signals + Liquidity)
- 185.65 (EMA 50 - Chart 2 — Delta + Technical)
Invalidation
Structural failure occurs if price breaches the 199.75 level (Chart 1 — Signals + Liquidity).
Risk Notes
- Conflict between structural weakness regime and positive delta/liquidity alignment.
- Potential for chop as price navigates secondary order blocks between key EMA and liquidity levels.
COIN — Signals + Liquidity (click to expand)
Visible Context
| Symbol | Timeframe | Layout Confidence |
|---|---|---|
| COIN | 1D | high |
Signal Engine
| Direction | Declaration | Trigger | Trigger Status | Stop / Invalidation |
|---|---|---|---|---|
| SHORT | Weakness Below | 181.05 | Triggered | 199.75 |
Target Ladder
| T1 | T2 | T3 | T4 | T5 | Booked | Next Unbooked |
|---|---|---|---|---|---|---|
| 181.05 (Booked) | 183.48 (Booked) | 179.67 (Booked) | 168.25 | N/A | T1, T2, T3 | T4 at 168.25 |
Structure Context
| Float-Volume Zones | Momentum Band | Dominant Cycle | Price Location | Structural Context |
|---|---|---|---|---|
| Price is rejecting a pink extreme float-volume zone near 210.00 and is currently within a pink weakness regime. | weakness; price is within the pink momentum weakness band | bearish; price is interacting with the pink negative cycle ribbon | Price is below the trigger (181.05) and moving toward T4 (168.25), having recently rejected the upper pink zone. | The setup is clean as price has confirmed the weakness declaration by breaking the trigger and is currently navigating through secondary order blocks. |
Setup Read
| State | R:R to T1 | R:R to Furthest | Invalidation | Evidence Quality | Notes |
|---|---|---|---|---|---|
| active | N/A | N/A | Stop at 199.75 | high | The setup is currently in a state of price rejection from a pink extreme float-volume zone with momentum bands and cycle ribbons indicating bearish regime pressure. |
COIN — Delta + Technical (click to expand)
OCS Layout Presence
| Delta Configuration Badge | Delta Histogram / CVD | Liquidity Overlay / Cycle |
|---|---|---|
| Ocs Ai Trader | Delta Configuration visible in the middle pane | green and red CVD columns with green delta-force arrows below the price action | visible positive liquidity bands and stepped liquidity lines overlaying price |
Liquidity Engine
| Active Band | Vs Slow Liquidity | Vs Fast Liquidity | Cycle State | Divergence | Hands-Off Risk |
|---|---|---|---|---|---|
| positive with latest price context in the bullish zone | above | above | alignment | none | low |
Delta Engine
| CVD Pressure | Dominant Cycle Leader | Adaptive Filter | Delta Force | Exhaustion Boundary |
|---|---|---|---|---|
| net buying | positive | N/A | recent green arrows | none |
Secondary TA
| EMA | RSI | MACD |
|---|---|---|
| EMA 20: 188.85, EMA 50: 185.65 | RSI 14: 49.45 54.51 | MACD 12 26 9: -1.31 4.32 5.63 |
Confluence
| Setup Type | Directional Bias | Conviction | Confirmation | Contradiction | Key Level |
|---|---|---|---|---|---|
| trend-continuation long | bullish | medium | Price is holding above the slow positive liquidity line with a positive delta-force rhythm shown in the CVD columns. | None visible. | 186.85 |
BTC (Bitcoin)
- Current Price: $37.25 (-0.51%)
- Analysis: BTC is increasingly behaving as a settlement layer. The decoupling from traditional banking beta is the key narrative here.
- Levels to Watch: $35.92 (Bollinger Mid) as support.
- Risk: Regulatory arbitrage tail risk. Any "custody concentration" event would disproportionately impact spot BTC liquidity.
IBIT / FBTC (BlackRock / Fidelity Bitcoin ETFs)
- Current Price: IBIT $47.73 / FBTC $73.33
- Analysis: These are the primary beneficiaries of the "institutional on-ramp." As backend settlement improves, tracking error should decrease, making these the preferred institutional vehicles.
- Risk: High correlation with NQ/QQQ as they become integrated into broader tech-equity portfolio rebalancing.
XLF (Financial Select Sector SPDR)
- Current Price: $53.49 (+0.06%)
- Analysis: The legacy benchmark. The sector rotation away from traditional regional bank payment divisions toward crypto-native infrastructure is a slow-motion headwind for XLF.
Historical Parallels
The current transition in crypto-infrastructure mirrors the evolution of electronic trading in the late 1990s and early 2000s. Just as firms like E-Trade and Schwab disrupted the high-commission brokerage model of the 80s, the current shift toward regulated, low-friction crypto-payment rails is disrupting the high-fee exchange model. The "compliance moat" is similar to the late-stage consolidation of the banking sector post-2008, where the regulatory burden favored the largest, most capitalized players, leading to a "too big to fail" environment.
Outlook & Risk Matrix
Short-Term (1-5 Days)
- Sentiment: Cautious. The market is digesting the regulatory friction (OCC lawsuit) while testing technical support levels.
- Key Levels: Watch BTC $35.92 and COIN $185.86. A break below these levels would signal a short-term liquidity contraction.
Medium-Term (1-4 Weeks)
- Sentiment: Constructive on regulated infrastructure.
- Scenario:
- Bull Case: The "Fintech Re-rating" gains traction, and COIN successfully pivots to a SaaS-revenue model, decoupling from crypto-volatility.
- Bear Case: The OCC lawsuit gains momentum, creating a "custody crisis" that forces capital out of custodial-reliant firms and causes a temporary liquidity vacuum in crypto-native equities.
What to Watch
- Regulatory Updates: Any further developments in the ICBA vs. OCC litigation. This is the single biggest "tail risk" to the custodial model.
- OpenPayd Listing Progress: Watch for news on the finalized merger with Titan Acquisition Corp. This will be the bellwether for the "Fintech Re-rating" thesis.
- ETF Flows: Monitor IBIT/FBTC volume. If volume remains high despite price consolidation, it confirms the "institutional on-ramp" narrative.
- Stablecoin Velocity: Any data indicating increased use of stablecoins for non-speculative treasury management (e.g., cross-border B2B payments) will be a bullish signal for the underlying assets (BTC/ETH).
Education and market research only, not financial advice. Charts are OCS AI Trader readings at the time of writing and change with new bars.