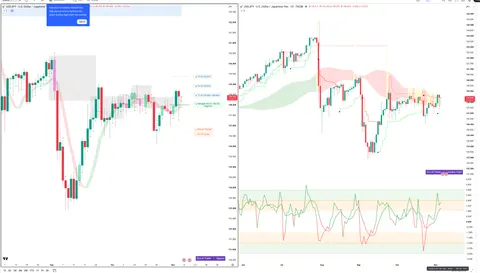
The North American Divergence: Labor Market Prints Spark USDCAD Breakout and Capital Reallocation
The global macro landscape shifted on November 7, 2026, as a stark divergence in North American labor market data forced a fundamental repricing of the USD-CAD exchange rate. The U.S. Bureau of Labor Statistics reported a robust non-farm payrolls (NFP) print of 165,000, significantly outperforming the 65,000 consensus estimate. Simultaneously, Canada reported a contraction in employment of 4,700, missing the expected 13,600 gain.
This data mismatch is not merely a statistical anomaly; it is a catalyst for a structural shift in interest rate differentials. As the U.S. labor market signals a "higher-for-longer" terminal rate environment, the Canadian economy faces a cooling labor market, narrowing the policy options for the Bank of Canada (BoC). This report traces the cascading impacts of this divergence, from the immediate FX breakout to the non-obvious liquidity drains impacting global tech valuations and industrial margins.
Executive summary
The primary driver of current market volatility is the widening real interest rate differential between the U.S. and Canada, triggered by the November labor market prints. The U.S. NFP beat has effectively reset market expectations for the Federal Reserve’s terminal rate, drawing capital into USD-denominated assets. Conversely, the Canadian labor contraction has left the BoC in a policy trap, unable to match U.S. tightening without risking a domestic recession.
This divergence is propagating through four distinct layers:
Immediate FX Repricing: A swift breakout in USDCAD, breaching the 1.4120 level.
Capital Flight: Institutional rebalancing out of Canadian fixed income into U.S. Treasuries (TLT/SHY).
Import Inflation: A weaker CAD is creating an "import inflation" cycle, compressing margins for Canadian industrial and material firms (XLB/XLI).
Liquidity Vacuum: The yield-seeking rotation from CAD debt to U.S. Treasuries is creating a secondary liquidity drain on U.S. high-multiple tech (NQ/QQQ), amplifying volatility in growth indices.
Major Events & Direct Impacts (Layer 1)
The immediate market response was a classic "dollar-strength" reaction. The U.S. NFP surprise of 165k vs 65k expected provided a direct tailwind for the DXY and UUP. The market immediately priced out aggressive near-term Fed rate cuts, shifting the yield curve higher and steeper.
The USDCAD pair, reflecting the opposing health of the two North American labor markets, rallied to approximately 1.4120. This move represents a direct consequence of the widening yield spread. As the U.S. labor market demonstrates resilience, the "relative yield advantage" of the USD has become the dominant trade.
Simultaneously, broader equity indices (ES, NQ) began to reflect the "higher-for-longer" reality. The reduction in the probability of near-term rate cuts has forced a valuation reassessment for high-beta growth assets. Furthermore, the Federal Reserve’s ongoing regulatory scrutiny of specific financial institutions—evidenced by the termination of various enforcement actions—is adding a layer of compliance-cost uncertainty that is tempering the bullish sentiment in the financial sector (XLF).
Secondary Effects & Sector Rotation (Layer 2)
The direct FX and rate impacts have triggered a predictable but potent secondary wave of capital rotation. The most significant effect is the widening interest rate differential, which is forcing institutional investors to rotate capital out of Canadian debt markets and into U.S. Treasuries.
This capital flight is not just currency-hedging; it is a fundamental re-allocation of yield-seeking capital. As investors sell Canadian fixed income, the resulting downward pressure on the CAD is self-reinforcing.
For the real economy, the weaker CAD is acting as a tax on Canadian manufacturers and importers. Firms in the industrial and material sectors (XLB, XLI) are facing an increased input cost burden, as machinery and raw materials are typically priced in USD. This margin compression is beginning to show in earnings expectations, creating a defensive rotation away from Canadian-linked industrial proxies.
Meanwhile, the energy sector (WTI, BRENT, XLE) is experiencing a "double-whammy." The inverse correlation between DXY strength and dollar-denominated commodities is reducing the realized price of oil for producers, while the weaker CAD is increasing their operational costs. This is causing a valuation divergence, where Canadian-linked energy producers are significantly underperforming their global peers.
Macro Propagation & Cross-Asset Flows (Layer 3)
The propagation of these effects is reaching into the core of North American macro-stability. The divergence in labor market prints has accelerated the USDCAD breakout, creating a feedback loop of FX-driven import inflation.
As the CAD weakens, the cost of imported goods in Canada rises, which would typically force a central bank to raise rates. However, with the Canadian labor market contracting, the BoC is in a "policy trap." Raising rates to defend the currency would exacerbate the domestic labor weakness, while holding rates steady allows the CAD to slide further.
This macroeconomic impasse is driving a massive capital shift. Institutional investors, recognizing the limited upside in Canadian debt, are increasing demand for U.S. Treasuries (TLT/SHY). This increased demand for U.S. sovereign debt is, ironically, suppressing U.S. yields slightly, but the primary macro effect remains the drain of liquidity from the Canadian financial system.
The energy sector's valuation headwind is also becoming a macro-narrative. As USDCAD rises, the realized price of oil for Canadian producers—denominated in CAD—faces extreme volatility. This is not just a localized issue; it is creating a global headwind for dollar-denominated commodity pricing, as the market recalibrates the supply-demand balance in light of the weaker purchasing power of energy-importing economies linked to the CAD.
Non-Obvious Connections & Hidden Risks (Layer 4)
The most critical insight for institutional participants lies in the non-obvious feedback loops created by this divergence.
1. The 'Dual-Squeeze' on Canadian Industrial Margins:
This is a feedback loop where U.S. labor strength drives USDCAD higher. This, in turn, increases the cost of USD-denominated raw materials (XLB) and machinery (XLI) for Canadian firms. The resulting inflation forces the Bank of Canada into a policy trap—they cannot raise rates to support the currency without crushing domestic demand. This leaves Canadian industrial firms with no relief, forcing a structural margin compression that the market is only beginning to price in.
2. Capital Flight Liquidity Drain on U.S. Tech:
There is a hidden correlation between Canadian debt outflows and U.S. tech volatility. As institutional capital retreats from Canadian debt, it creates a "yield-seeking" vacuum. This capital often rotates into U.S. Treasuries, but in the process, it shifts the risk-free benchmark. This higher discount rate is then applied to high-multiple tech stocks (NQ/QQQ). The capital isn't just moving assets; it is shifting the valuation multiple for growth stocks, amplifying volatility in NQ beyond what the U.S. labor data alone would suggest.
3. The 'Safe-Haven' Paradox:
In a typical USD-strength scenario, gold (GLD) falls. However, if the Canadian labor data weakness signals a broader North American growth slowdown, investors may initiate a "flight to quality" that decouples gold from the DXY. The market is increasingly hedging against the tail risk of a North American hard landing, which could lead to a scenario where both the DXY and Gold rise in tandem—a non-obvious correlation break.
Unified OCS Chart Read
USDCAD: The pair has breached technical resistance at 1.4120. Without captured chart evidence, we rely on the fundamental thesis: the divergence in labor data provides a strong, structural tailwind. The setup appears to be a sustained breakout rather than a mean-reversion, given the widening interest rate differential.
NQ: The technicals (RSI 31.2, MACD -16.8) suggest an oversold condition, but the fundamental pressure from rising real yields (due to the capital flight/yield-seeking vacuum) suggests the recovery may be capped. Confirmation of a bottom would require a stabilization in the U.S. 10-year yield, which is currently pressured by the influx of capital from Canadian debt.
SHY: The technical indicators (RSI 59.42, MACD 0.07) show a market digesting the influx of capital. The setup is neutral-to-bullish as it absorbs the rotation from Canadian fixed income.
Disclaimer: OCS chart evidence will be appended after initial publication. Levels mentioned are based on recent price history and market commentary.
Security-by-Security Analysis
USDCAD
Status: Bullish momentum breakout.
Key Level: 1.4120 resistance breached.
Thesis: Labor market divergence is the primary driver. As long as the U.S. labor market remains resilient relative to Canada, the fundamental pressure for a higher USDCAD persists.
Risk: A sudden BoC hawkish pivot or a significant U.S. economic data miss could trigger a sharp reversal.
NQ (Nasdaq 100)
Fig. 1 NQ — Signals + Liquidity · open full sizeFig. 2 NQ — Delta + Technical · open full sizeNQ — Unified OCS chart read
Executive Summary
The consensus direction remains bearish based on structural momentum, though immediate participation is shifting toward a hands-off/uncertain state. While Chart 1 — Signals + Liquidity confirms a high-confidence 'Weakness Below' signal with two targets already booked, Chart 2 — Delta + Technical indicates a loss of aggressive selling pressure, characterized by tangled delta cycles and an oversold RSI (30.72). The market is currently navigating a transition zone between liquidity bands, suggesting a potential pause or consolidation before the next leg toward T3.
OCS Confluence
Grade
Directional Bias
Participation State
medium
bearish
hands-off
Setup Read: NQ exhibits a structural bearish bias with momentum-driven targets, though immediate delta participation is currently tangled and transitioning through a liquidity uncertainty zone.
Confirmations
Both charts place price in a non-trending/transition zone relative to primary momentum/liquidity structures.
Price is currently trading below both the primary volume zones (Chart 1) and the slow/fast negative liquidity lines (Chart 2).
Chart 1 views the setup as an active weakness continuation, while Chart 2 suggests an exhausted or uncertain liquidity state.
Levels To Watch
28335.50 (Trigger Level - Chart 1)
27500.00 (Key Level - Chart 2)
27425.00 (Current Price Location - Chart 1)
24171.25 (Next Unbooked Target T3 - Chart 1)
28220.83 (EMA 9 - Chart 2)
29021.97 (EMA 21 - Chart 2)
Invalidation
Structural failure would be defined by a reclaim of the primary pink extreme volume zone (approx 28000-28300) as noted in Chart 1.
Risk Notes
High risk of chop due to tangled delta cycles and converging liquidity lines (Chart 2).
Potential exhaustion risk as RSI is currently in an oversold condition (Chart 2).
Uncertainty regarding the transition between bullish and bearish liquidity bands (Chart 2).
NQ — Signals + Liquidity (click to expand)
Visible Context
Symbol
Timeframe
Layout Confidence
NQ1! NASDAQ 100 E-mini Futures
1D
high
Signal Engine
Direction
Declaration
Trigger
Trigger Status
Stop / Invalidation
SHORT
Weakness Below
28335.50
Triggered
N/A
Target Ladder
T1
T2
T3
T4
T5
Booked
Next Unbooked
27536.50 (Booked)
26858.50 (Booked)
24171.25
N/A
N/A
27536.50, 26858.50
24171.25
Structure Context
Float-Volume Zones
Momentum Band
Dominant Cycle
Price Location
Structural Context
Price is currently in open space below the primary pink extreme volume zone (approx 28000-28300) and the gray average volume zone.
weakness; price is trading within the pink momentum weakness band.
bearish; the pink ribbon is active and sloping downward.
Price is currently at 27,425.00, which is below the trigger (28335.50) and between booked T2 and pending T3.
The setup shows high confluence with price aligned within the pink weakness momentum band and the pink dominant cycle ribbon.
Setup Read
State
R:R to T1
R:R to Furthest
Invalidation
Evidence Quality
Notes
active
N/A
N/A
N/A
high
The price action follows a Weakness Below declaration, having already cleared two booked targets while maintaining alignment with bearish momentum and cycle ribbons.
NQ — Delta + Technical (click to expand)
OCS Layout Presence
Delta Configuration Badge
Delta Histogram / CVD
Liquidity Overlay / Cycle
Ocs Ai Trader | Delta Configuration visible at the bottom center of the main price panel.
Green and red CVD columns are visible in the bottom panel, showing alternating periods of net buying and net selling accumulation.
Visible liquidity bands (shading) and stepped liquidity lines overlaying the price action.
Liquidity Engine
Active Band
Vs Slow Liquidity
Vs Fast Liquidity
Cycle State
Divergence
Hands-Off Risk
uncertain, price is currently within a transition zone between bullish and bearish liquidity bands.
below slow negative liquidity line
below fast negative liquidity line
tangle, fast and slow liquidity lines are converging/crossing in the transition zone.
none
high, uncertain liquidity band is active with tangled cycle lines and price in a transition zone.
Delta Engine
CVD Pressure
Dominant Cycle Leader
Adaptive Filter
Delta Force
Exhaustion Boundary
mixed, recent columns show a transition from red selling accumulation to small green buying accumulation.
tangled, the delta cycles are overlapping and showing no clear single-direction rhythm.
mixed
absent
none
Secondary TA
EMA
RSI
MACD
EMA 9: 28,220.83, EMA 21: 29,021.97
RSI 14 close: 30.72 (oversold condition visible)
MACD close 12 26 9: -278.40, -704.47, -425.07
Confluence
Setup Type
Directional Bias
Conviction
Confirmation
Contradiction
Key Level
hands-off
neutral
low
N/A
Uncertain liquidity band and tangled delta cycles indicate a lack of clear directional commitment.
27,500.00
* **Status:** Volatile, rate-sensitive.
* **Key Level:** Watching the 650-660 range for support.
* **Thesis:** The index is caught in a "liquidity drain" caused by the rotation from Canadian debt to U.S. Treasuries. The higher discount rate is pressuring valuations.
* **Risk:** If the "yield-seeking vacuum" continues to pull capital into Treasuries, NQ may face further multiple compression.
SHY (1-3 Year Treasury Bond ETF)
Fig. 3 SHY — Signals + Liquidity · open full sizeFig. 4 SHY — Delta + Technical · open full sizeSHY — Unified OCS chart read
Executive Summary
The consensus direction for SHY is bullish, driven by a 'Strength Above' structural declaration (Chart 1 — Signals + Liquidity) and price trading above both fast and slow positive liquidity lines (Chart 2 — Delta + Technical). While the signal engine shows significant historical target realization (T2-T5 booked), the current participation state is characterized by a transition into 'uncertain liquidity' and 'tangled' delta cycles, suggesting a period of high-volatility navigation in open space.
OCS Confluence
Grade
Directional Bias
Participation State
medium
bullish
exhausted
Setup Read: SHY is navigating a bullish structural expansion in open space, testing the final unbooked target (T1) amidst transitioning liquidity and tangled delta cycles.
Confirmations
Price is trending above key structural levels and positive liquidity lines (Charts 1 & 2).
Momentum indicators (RSI/MACD) and the Momentum Band both support a bullish trend (Charts 1 & 2).
Price is currently navigating the gap between recent volume-block support and the next resistance (Chart 1).
Contradictions
Chart 1 signals high-quality strength with a 'Strength Above' declaration, whereas Chart 2 notes 'low' conviction due to tangled delta cycles and mixed CVD pressure.
Price is currently in open space, having recently broken above the gray average float-volume/order-block reference zone located between 81.15 and 81.30.
strength; price is trending within the green strength band.
transition; the pink cycle ribbon is flattening/narrowing as price tests higher levels.
Price (81.56) is above the trigger (81.57) proximity, near the unbooked T1 (81.60), and above the gray zone.
The setup shows high historical completion with T2-T5 booked, currently navigating the gap between the gray zone and the next momentum resistance.
Setup Read
State
R:R to T1
R:R to Furthest
Invalidation
Evidence Quality
Notes
exhausted
0.2, calculated from trigger 81.57 to T1 81.60 vs stop 81.40
N/A
A break below the stop at 81.40 or a return into the gray float-volume zone.
high
The structural declaration of Strength Above has seen significant target realization, with current price testing the final unbooked target (T1) in open space.
SHY — Delta + Technical (click to expand)
OCS Layout Presence
Delta Configuration Badge
Delta Histogram / CVD
Liquidity Overlay / Cycle
Ocs Ai Trader | Delta Configuration visible in the middle panel.
Visible CVD histogram with red (selling) and green (buying) columns, and green delta-force arrows at the bottom of the main chart.
Visible liquidity bands (pink/green shading) and stepped liquidity lines overlaid on the price chart.
Liquidity Engine
Active Band
Vs Slow Liquidity
Vs Fast Liquidity
Cycle State
Divergence
Hands-Off Risk
uncertain liquidity band (transitioning from negative to positive) with price currently at the upper edge of the recent consolidation.
at slow positive liquidity line
above fast positive liquidity line
fast and slow liquidity cycle lines are in a bullish cross/alignment
bullish divergence
medium due to price being in a transition/uncertain liquidity band
Delta Engine
CVD Pressure
Dominant Cycle Leader
Adaptive Filter
Delta Force
Exhaustion Boundary
mixed; recent green columns showing buying attempts offset by recent red columns
tangled
mixed
recent green delta-force arrows present
none
Secondary TA
EMA
RSI
MACD
EMA 51 close at 81.43
RSI 14 close at 59.32
MACD 12 26 9 at 0.0026
Confluence
Setup Type
Directional Bias
Conviction
Confirmation
Contradiction
Key Level
unclear
bullish
low
Price is trending above the fast and slow positive liquidity lines with bullish RSI and MACD readings.
The active uncertain liquidity band and tangled delta cycles indicate high transition risk.
81.43 (EMA 51)
* **Status:** Accumulation/Rotation phase.
* **Key Level:** 81.63 (Current price).
* **Thesis:** Serving as the landing pad for capital fleeing Canadian debt. The price is supported by this structural shift in institutional allocation.
* **Risk:** Sensitivity to Fed forward guidance; any indication of a shift in the "higher-for-longer" narrative could trigger volatility.
WTI (Crude Oil)
Fig. 5 WTI — Signals + Liquidity · open full sizeFig. 6 WTI — Delta + Technical · open full sizeWTI — Unified OCS chart read
Executive Summary
The current WTI setup is characterized by a neutral to bearish orientation with low conviction due to missing engine components. Price is currently navigating a red extreme float-volume zone near 70.00-71.00 (Chart 1 — Signals + Liquidity) while simultaneously testing a pink liquidity band (Chart 2 — Delta + Technical). Without the Signal Engine declaration or Delta/CVD confirmation, the participation state remains unverified.
OCS Confluence
Grade
Directional Bias
Participation State
hands-off
neutral
unclear
Setup Read: WTI is currently consolidating within a red extreme float-volume zone and a pink liquidity band, though a definitive directional declaration is absent.
Confirmations
Both charts identify price within or rejecting significant liquidity/volume zones at current levels
Price is situated in 'open space' between major momentum/strength bands (Chart 1) and lacks immediate delta confirmation (Chart 2)
Contradictions
Chart 1 lacks a visible Signal Engine declaration while Chart 2 lacks the Delta/CVD components necessary to validate the liquidity bands
Levels To Watch
70.00-71.00 Red Extreme Float-Volume Zone (Chart 1 — Signals + Liquidity)
70.35 Current Price (Chart 1 — Signals + Liquidity)
96.00-104.00 Pink Extreme Zone (Chart 1 — Signals + Liquidity)
Pink Liquidity Band (Chart 2 — Delta + Technical)
RSI 14 at 41.12 (Chart 2 — Delta + Technical)
Invalidation
N/A
Risk Notes
Low evidence quality due to missing Signal Engine and Delta Engine components
High hands-off risk due to inability to verify liquidity cycle via CVD
Conflicting setup as structural scaffolds are not fully visible in provided views
WTI — Signals + Liquidity (click to expand)
Visible Context
Symbol
Timeframe
Layout Confidence
USDIL: CFDs on WTI Crude Oil
1D
low
Signal Engine
Direction
Declaration
Trigger
Trigger Status
Stop / Invalidation
N/A
no visible declaration
N/A
N/A
N/A
Target Ladder
T1
T2
T3
T4
T5
Booked
Next Unbooked
N/A
N/A
N/A
N/A
N/A
N/A
N/A
Structure Context
Float-Volume Zones
Momentum Band
Dominant Cycle
Price Location
Structural Context
Price is currently at 70.35, sitting within/rejecting a red extreme float-volume zone (approx 70.00-71.00) and below a pink extreme zone (approx 96.00-104.00).
mixed; price is currently in open space between the pink weakness band (upper) and the green strength band (lower).
transition; the ribbon is flattening/stabilizing at the current lower price levels.
Price is at 70.35, below all momentum bands and the recent price action cluster.
The setup is conflicting as the Signal Scaffold (declaration, trigger, targets) is not visible on the provided chart view.
Setup Read
State
R:R to T1
R:R to Furthest
Invalidation
Evidence Quality
Notes
unclear
N/A
N/A
N/A
low
The Signal Engine scaffold is missing from the current view, preventing a complete directional read despite visible volume and momentum zones.
WTI — Delta + Technical (click to expand)
OCS Layout Presence
Delta Configuration Badge
Delta Histogram / CVD
Liquidity Overlay / Cycle
Ocs Ai Trader | Delta Configuration badge is visible in the middle of the chart.
N/A
Visible pink liquidity bands/zones on the main price chart.
Liquidity Engine
Active Band
Vs Slow Liquidity
Vs Fast Liquidity
Cycle State
Divergence
Hands-Off Risk
negative, with latest price currently sitting within/near a pink liquidity band
N/A
N/A
N/A
none
high, due to absence of visible delta/CVD engine components and liquidity cycle lines required for verification
Delta Engine
CVD Pressure
Dominant Cycle Leader
Adaptive Filter
Delta Force
Exhaustion Boundary
N/A
N/A
N/A
absent
N/A
Secondary TA
EMA
RSI
MACD
EMA 9 (blue) and EMA 21 (orange) are visible.
RSI 14 close at 41.12 is visible.
MACD (12, 26, 9) is visible.
Confluence
Setup Type
Directional Bias
Conviction
Confirmation
Contradiction
Key Level
hands-off
neutral
low
N/A
The OCS Delta engine (CVD, Delta Force, Adaptive Filters) is not visible on this chart, making it impossible to validate the liquidity bands.
N/A
* **Status:** Bearish (Margin compression).
* **Key Level:** 3.09 (Current price).
* **Thesis:** Facing a "double-whammy": DXY strength acts as a global headwind, and a weaker CAD increases operating costs for Canadian-linked producers.
* **Risk:** Geopolitical risk premiums are currently dampened; any escalation in the Middle East could override the FX-driven margin compression.
Historical Parallels
The current scenario bears a striking resemblance to the Q3 2022 period, where a similar divergence in labor market resilience between the U.S. and Canada occurred. During that time, the BoC was forced to pause its tightening cycle earlier than the Fed, leading to a significant USDCAD rally and a period of sustained underperformance for Canadian industrial equities. The key takeaway from 2022 is that the FX move preceded the broader equity market rotation by approximately 2-3 weeks.
Outlook & Risk Matrix
Short-Term (1-5 Days)
Outlook: USDCAD momentum is likely to persist as the market digests the full implication of the NFP vs. Canada employment miss.
Scenario: Base case is a consolidation around the 1.4120 level, with potential for a test of 1.4200 if U.S. Treasury yields continue to rise.
Medium-Term (1-4 Weeks)
Outlook: The "policy trap" for the BoC becomes the dominant narrative.
Scenario: Bull case for USDCAD if the BoC signals a dovish shift; Bear case if the BoC is forced to hike despite labor weakness to prevent a currency collapse.
Risk Matrix
Risk Factor
Impact
Probability
BoC Policy Trap
High
High
U.S. Inflation Rebound
High
Medium
Tech Sector Deleveraging
Medium
Medium
Geopolitical Oil Shock
Low
Low
What to Watch
Bank of Canada Rhetoric: Any shift in the BoC’s tone regarding the CAD and import inflation is the primary "event risk" that could invalidate the current USDCAD bullish thesis.
U.S. Treasury Yields: Watch the 2-year and 10-year yields. If the capital flight from Canada continues to suppress U.S. yields, it may provide a reprieve for tech stocks (NQ). If U.S. yields rise in tandem with the DXY, the pressure on NQ will intensify.
Canadian Industrial Earnings: Monitor guidance from Canadian industrial and material firms for mentions of FX-driven margin compression. This will confirm the Layer 4 "Dual-Squeeze" thesis.
Tech Liquidity: Monitor daily volume on the NQ futures and QQQ ETF. A persistent decline in volume alongside price volatility would confirm the "liquidity vacuum" theory.
Education and market research only, not financial advice. Charts are OCS AI Trader readings at the time of writing and change with new bars.