The ZEC ETF Pivot: Institutionalizing Privacy and the Liquidity Bifurcation
Executive summary
The filing of a spot Zcash (ZEC) ETF by Winklevoss Asset Services on October 6, 2026, marks a pivotal moment in the institutionalization of digital assets. While the headline focuses on the asset itself, the true market impact lies in the regulatory stress test this creates for privacy-centric assets. We are observing a structural bifurcation in crypto liquidity: a migration toward "compliant" ETF-backed assets (IBIT, FBTC, ETHE) and a simultaneous discount on "high-scrutiny" assets. This shift is creating a "Safety Premium" liquidity trap, where institutional capital clusters in regulated proxies, potentially decoupling them from the broader risk-on beta of the Nasdaq (NQ) and creating a new correlation between crypto-ETFs and traditional safe-haven assets like Gold (GLD).
Layer 1: Direct Impacts — The Regulatory Stress Test
The immediate catalyst is the registration statement for a spot Zcash ETF to trade on the Nasdaq. This filing is a direct challenge to current regulatory norms regarding privacy coins.
Institutional Validation: The filing attempts to bring a privacy-centric asset under the umbrella of SEC-regulated transparency. If successful, this would validate ZEC as an institutional-grade asset, contrasting sharply with the SEC's historical hostility toward privacy-preserving technology.
Stablecoin Friction: Concurrently, the lawsuit between Conduit and Tether regarding the freezing of $2.8M highlights the fragility of stablecoin liquidity. As institutional managers (like Brevan Howard) expand their crypto-linked prime brokerage services, they are increasingly sensitive to counterparty risk. Stablecoin-dependent trading pairs are facing short-term liquidity uncertainty as custodial practices come under renewed scrutiny.
Layer 2: Secondary Effects — The Compliance Moat
The ZEC filing forces a re-evaluation of listing standards for exchanges and prime brokers.
The 'Privacy' Compliance Friction: Regulatory friction from the ZEC filing forces exchanges to re-evaluate listing standards. We expect a widening gap between "compliant" assets (BTC/ETH) and "privacy" assets. This creates operational overhead for prime brokers who must now manage complex risk-weighting for privacy-focused coins, potentially leading to liquidity fragmentation.
Guilt-by-Association: Publicly traded crypto-proxies like Coinbase (COIN) and MicroStrategy (MSTR) are facing a "guilt-by-association" volatility spike. As the SEC scrutinizes the mechanics of privacy coins, market participants are discounting the earnings multiples of these proxies, fearing that regulatory enforcement could target the exchanges that facilitate privacy-coin trading.
Layer 3: Macro Propagation — The Liquidity Bifurcation
The ripple effects are moving from individual assets to structural market shifts.
Institutional Liquidity Bifurcation: We are seeing a clear migration of capital. Institutions are prioritizing "regulatory safety" profiles, leading to a rotation out of non-ETF-eligible assets into established vehicles like IBIT, FBTC, and ETHE. This is tightening spreads for major-cap crypto while widening them for privacy-centric coins and smaller alt-coins.
DXY Feedback Loop: The regulatory friction acts as a "risk-off" signal. As uncertainty rises, capital rotates back into USD-denominated safe havens. This strengthens the DXY, which in turn increases the cost of borrowing for crypto-linked prime brokerages, forcing them to deleverage positions in high-beta altcoins like SOL, further exacerbating the liquidity drainage in the broader crypto ecosystem.
Layer 4: Non-Obvious Connections — The 'Safety Premium' Trap
The most critical development is the emergence of a "Safety Premium" liquidity trap.
The Crypto-Gold Correlation: As institutional rotation accelerates away from altcoins into BTC/ETH ETFs, a crowding effect is occurring. These ETFs are increasingly trading as "regulatory-safe" havens rather than high-beta tech plays. This is driving a positive correlation between BTC ETFs and GLD, potentially decoupling them from the broader risk-on beta of the Nasdaq (NQ).
Semiconductor Policy/Crypto-Proxy Divergence: We are tracking a divergence between crypto-proxies (COIN/MSTR) and hardware-focused AI plays (SMH/NVDA). If regulatory headlines intensify, capital is rotating from crypto-proxies into hardware-focused AI plays, as the latter are perceived as having more "tangible" regulatory support via onshoring initiatives, while crypto-proxies are viewed as "regulatory-sensitive."
Unified OCS Chart Read
Status: OCS chart evidence is currently unavailable due to system-wide capture deferral. The following technical analysis is derived from live market data.
BTC: Technicals suggest a neutral-to-bullish posture, with the price ($37.84) hovering near the 20-day EMA ($36.09). RSI(14) at 66.81 indicates the asset is approaching overbought territory but lacks the momentum to break decisively above the Bollinger Upper Band ($39.28).
ETH: Price ($25.66) is consolidating between the 20-day SMA ($24.86) and the Bollinger Upper Band ($27.1). The MACD histogram is slightly negative (-0.12), suggesting a lack of immediate upside catalyst.
COIN: Trading at $185.74, the stock is testing its 20-day SMA ($186.04). The MACD histogram (-1.28) and the recent volatility (Day Range $184.82 - $192.80) suggest a cautious environment.
MSTR: Showing resilience at $164.55, well above the 50-day SMA ($125.06). However, the MACD histogram is negative (-0.36), signaling a consolidation phase.
Security-by-Security Analysis
BTCUSD / BTC
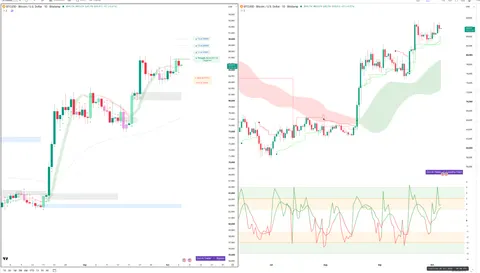
Fig. 1 BTC — Signals + Liquidity · open full sizeFig. 2 BTC — Delta + Technical · open full sizeBTC — Unified OCS chart read
Executive Summary
The unified outlook is bullish, characterized by a 'Strength Above' structural declaration (Chart 1) supported by active accumulation shown through green CVD columns and delta-force arrows (Chart 2). While price is currently testing a red extreme float-volume zone (Chart 1), the liquidity engine remains positive, holding above both fast and slow liquidity lines (Chart 2). The setup reflects a trend-continuation regime with high-quality evidence from both momentum bands and delta pressure.
OCS Confluence
Grade
Directional Bias
Participation State
high
bullish
active
Setup Read: BTC displays a high-confluence trend-continuation setup as structural strength aligns with positive delta accumulation and liquidity support.
Confirmations
Bullish structural alignment between Chart 1's 'Strength Above' declaration and Chart 2's net buying CVD pressure.
Price location above both the Chart 1 trigger (86773) and Chart 2 slow positive liquidity line.
Regime transition confirmed by Chart 1's steep upward dominant cycle ribbon and Chart 2's positive delta cycle leader.
Contradictions
Chart 1 identifies a red extreme float-volume zone at 84,000-85,000, while Chart 2 notes price is testing recent local highs near an overbought RSI.
Structural failure occurs if price breaches the stop level at 84251 (Chart 1).
Risk Notes
RSI nearing overbought territory (Chart 2).
Price testing a red extreme float-volume zone (Chart 1).
Potential for local exhaustion near recent highs (Chart 2).
BTC — Signals + Liquidity (click to expand)
Visible Context
Symbol
Timeframe
Layout Confidence
BTCUSD - Bitcoin / U.S. Dollar · 1D · Bitstamp
1D
high
Signal Engine
Direction
Declaration
Trigger
Trigger Status
Stop / Invalidation
LONG
Strength Above
86773
Triggered
84251
Target Ladder
T1
T2
T3
T4
T5
Booked
Next Unbooked
N/A
N/A
88991
92441
95004
None
T3 at 88991
Structure Context
Float-Volume Zones
Momentum Band
Dominant Cycle
Price Location
Structural Context
Price is currently interacting with a red extreme float-volume zone at 84,000-85,000
strength with price currently located within the green strength band
bullish with a steep ribbon indicating regime transition upward
Price is above the trigger (86773) and the stop (84251), currently testing the red zone before target T3
The setup shows high confluence as the price, momentum band, and dominant cycle are all aligned with the Strength Above declaration.
Setup Read
State
R:R to T1
R:R to Furthest
Invalidation
Evidence Quality
Notes
active
N/A
N/A
Stop at 84251
high
Price is currently testing a red extreme float-volume zone following a Strength Above declaration, with the momentum band and dominant cycle ribbon showing alignment with the upside declaration.
BTC — Delta + Technical (click to expand)
OCS Layout Presence
Delta Configuration Badge
Delta Histogram / CVD
Liquidity Overlay / Cycle
Ocs Ai Trader | Delta Configuration purple badge visible
Green CVD columns in the bottom panel with green delta-force arrows above the bars
Visible green liquidity bands and stepped liquidity lines on the price chart
Liquidity Engine
Active Band
Vs Slow Liquidity
Vs Fast Liquidity
Cycle State
Divergence
Hands-Off Risk
positive liquidity band with latest price context being a recent test of local highs
above slow positive liquidity line
above fast positive liquidity line
fast/slow liquidity cycle lines are near alignment
none
low
Delta Engine
CVD Pressure
Dominant Cycle Leader
Adaptive Filter
Delta Force
Exhaustion Boundary
net buying
positive
N/A
green delta-force arrows
none
Secondary TA
EMA
RSI
MACD
EMA 50 and 200 visible
RSI 14 visible
MACD visible with histogram and signal lines
Confluence
Setup Type
Directional Bias
Conviction
Confirmation
Contradiction
Key Level
trend-continuation long
bullish
medium
Price remains above the slow positive liquidity line with a positive dominant delta cycle and green CVD columns indicating accumulation.
The RSI is nearing overbought territory and price is testing recent local highs.
85,344
* **Snapshot:** Price $37.84.
* **Analysis:** BTC remains the anchor for institutional liquidity. The ZEC ETF filing is a net positive for the *concept* of crypto ETFs, but it introduces regulatory noise. Watch the $38.33 (Day High) and $37.75 (Day Low) levels for breakout or breakdown.
* **Risk:** The "Safety Premium" trap suggests BTC ETFs may trade more like bonds/gold than tech stocks in the short term.
ETHUSD / ETH
Fig. 3 ETH — Signals + Liquidity · open full sizeFig. 4 ETH — Delta + Technical · open full sizeETH — Unified OCS chart read
Executive Summary
The consensus view is a bullish trend-continuation characterized by an exhausted participation state. While Chart 1 — Signals + Liquidity identifies a successful long setup that has already booked T1 and T2, Chart 2 — Delta + Technical confirms the underlying strength through net buying accumulation and green CVD columns. Current price action is testing an extreme float-volume zone, suggesting a period of consolidation before attempting to reach the next unbooked target.
OCS Confluence
Grade
Directional Bias
Participation State
medium
bullish
exhausted
Setup Read: ETH is currently consolidating within an extreme volume zone following the completion of initial strength targets, supported by positive delta force and net buying accumulation.
Confirmations
Bullish momentum alignment between Chart 1's upward sloping green ribbon and Chart 2's positive delta cycle leader.
Price action is supported by net buying accumulation per Chart 2's green CVD columns and Chart 1's strength band positioning.
Structural floor established by Chart 2's slow positive liquidity line and Chart 1's trigger level of 2729.51.
Structural failure occurs if price closes below the stop level of 2681.73 (Chart 1 — Signals + Liquidity).
Risk Notes
Setup exhaustion noted as price tests extreme pink float-volume zones (Chart 1).
Crowded trade profile due to recent target completions (Chart 1).
Consolidation risk while testing upper boundaries of positive liquidity bands (Chart 2).
ETH — Signals + Liquidity (click to expand)
Visible Context
Symbol
Timeframe
Layout Confidence
ETHUSD · Ethereum / U.S. Dollar · 1D · Coinbase
1D
high
Signal Engine
Direction
Declaration
Trigger
Trigger Status
Stop / Invalidation
LONG
Strength Above
2729.51
Triggered
2681.73
Target Ladder
T1
T2
T3
T4
T5
Booked
Next Unbooked
2729.51
2789.41
2884.41
N/A
N/A
T1, T2
T3 at 2884.41
Structure Context
Float-Volume Zones
Momentum Band
Dominant Cycle
Price Location
Structural Context
Price is currently rejecting the pink extreme float-volume zone near 2729.51
strength; price action is operating within the green strength band
bullish; green ribbon is sloping upwards supporting recent price action
Price is trading within a pink zone, above the trigger of 2729.51 and the stop of 2681.73, currently below unbooked T3.
The setup is crowded as price has already booked two targets and is currently testing an extreme volume zone.
Setup Read
State
R:R to T1
R:R to Furthest
Invalidation
Evidence Quality
Notes
exhausted
N/A
N/A
Stop at 2681.73
high
Price is currently consolidating within a pink extreme float-volume zone after completing previous strength targets.
ETH — Delta + Technical (click to expand)
OCS Layout Presence
Delta Configuration Badge
Delta Histogram / CVD
Liquidity Overlay / Cycle
Ocs Ai Trader | Delta Configuration visible in purple center badge
Green CVD columns indicating net buying accumulation and green delta force arrows at the bottom of the frame
Visible liquidity bands (positive/green and negative/pink) and stepped liquidity lines
Liquidity Engine
Active Band
Vs Slow Liquidity
Vs Fast Liquidity
Cycle State
Divergence
Hands-Off Risk
positive liquidity band, price near upper boundary
above
above
slow positive line providing floor support
none
low
Delta Engine
CVD Pressure
Dominant Cycle Leader
Adaptive Filter
Delta Force
Exhaustion Boundary
net buying
positive
bullish floor
absent
none
Secondary TA
EMA
RSI
MACD
EMA 10 and EMA 17 visible
RSI 14 close visible
MACD 12 26 9 visible
Confluence
Setup Type
Directional Bias
Conviction
Confirmation
Contradiction
Key Level
trend-continuation long
bullish
medium
Price is holding above the slow positive liquidity line while the dominant delta cycle is positive, supported by green CVD accumulation.
None visible.
slow positive liquidity line (approx 2,550-2,600 area)
* **Snapshot:** Price $25.66.
* **Analysis:** ETH continues to track BTC but with higher sensitivity to DeFi regulatory headlines. The Tether/Conduit lawsuit is a headwind for stablecoin-based ETH trading pairs.
* **Risk:** Liquidity fragmentation in prime brokerages could lead to wider slippage for ETH-based DeFi strategies.
COIN
Fig. 5 COIN — Signals + Liquidity · open full sizeFig. 6 COIN — Delta + Technical · open full sizeCOIN — Unified OCS chart read
Executive Summary
The setup presents a structural conflict between a residual bearish declaration and dominant bullish participation. While Chart 1 — Signals + Liquidity maintains an active 'Weakness Below' SHORT signal, Chart 2 — Delta + Technical shows high-conviction bullishness via net buying CVD, positive liquidity bands, and a trend-continuation profile. Current price action is trending upward within the strength band, suggesting the original downside signal is being rejected by order flow.
OCS Confluence
Grade
Directional Bias
Participation State
medium
bullish
active
Setup Read: COIN is currently exhibiting bullish trend-continuation characteristics despite a legacy bearish signal declaration, supported by positive liquidity and net buying pressure.
Confirmations
Price action is currently trading within the green strength band (Chart 1 — Signals + Liquidity).
Dominant cycle ribbon is active and sloping upwards (Chart 1 — Signals + Liquidity) aligned with a bullish cycle state (Chart 2 — Delta + Technical).
Contradictions
The 'Weakness Below' SHORT declaration in Chart 1 is being actively countered by bullish liquidity and net buying pressure in Chart 2.
Structural failure occurs if price loses the 199.75 invalidation level (Chart 1 — Signals + Liquidity).
Risk Notes
Conflict between structural signal (bearish) and delta/liquidity (bullish) creates potential for chop.
Price is trading in open space above recent volume-weighted reference zones.
COIN — Signals + Liquidity (click to expand)
Visible Context
Symbol
Timeframe
Layout Confidence
COIN
1D
high
Signal Engine
Direction
Declaration
Trigger
Trigger Status
Stop / Invalidation
SHORT
Weakness Below
181.05
Triggered
199.75
Target Ladder
T1
T2
T3
T4
T5
Booked
Next Unbooked
187.05 (Booked)
183.48 (Booked)
179.67
168.25
N/A
T1, T2
T4 at 168.25
Structure Context
Float-Volume Zones
Momentum Band
Dominant Cycle
Price Location
Structural Context
Price is in open space, having moved above the blue secondary order block (approx 155-165) and the gray average float-volume reference (approx 175-185).
strength; price is trading within the green strength band
bullish; green ribbon is active and sloping upwards under current price action
Price is at 186.51, above the trigger (181.05) and stop (199.75), between booked T2 (183.48) and pending T3 (179.67) relative to the original downside declaration logic, but currently trending upward.
The setup is conflicting because the active 'Weakness Below' declaration is being countered by current price action moving higher within the strength band and above the dominant cycle ribbon.
Setup Read
State
R:R to T1
R:R to Furthest
Invalidation
Evidence Quality
Notes
active
N/A
N/A
Stop at 199.75
high
Price is currently trending within the green strength band and above the green dominant-cycle ribbon, having recently cleared the pink weakness zone.
COIN — Delta + Technical (click to expand)
OCS Layout Presence
Delta Configuration Badge
Delta Histogram / CVD
Liquidity Overlay / Cycle
Ocs Ai Trader | Delta Configuration
Visible green and red CVD columns at the bottom panel showing volume commitment.
Visible stepped liquidity lines and positive liquidity band behind the price action.
Liquidity Engine
Active Band
Vs Slow Liquidity
Vs Fast Liquidity
Cycle State
Divergence
Hands-Off Risk
positive liquidity band
above slow positive line
above fast positive line
fast/slow cycle alignment (bullish)
none
low
Delta Engine
CVD Pressure
Dominant Cycle Leader
Adaptive Filter
Delta Force
Exhaustion Boundary
net buying
positive
bullish floor
absent
none
Secondary TA
EMA
RSI
MACD
EMA 13: 168.13, EMA 21: 166.05
RSI 14 close: 50.95 53.19
MACD close 12 26 9: -1.47 3.47 4.93
Confluence
Setup Type
Directional Bias
Conviction
Confirmation
Contradiction
Key Level
trend-continuation long
bullish
high
Price is trading above both fast and slow positive liquidity lines with a positive dominant cycle and net buying accumulation in CVD.
None visible.
188.51
* **Snapshot:** Price $185.74.
* **Analysis:** COIN is the primary "regulatory beta" play. If the SEC focuses on privacy-coin mechanics, COIN is likely to see the most direct volatility. The options chain shows significant put activity at the $170-$177.5 levels, indicating market participants are hedging against a downside move.
* **Risk:** "Guilt-by-association" remains the primary threat to the stock's multiple.
MSTR
Fig. 7 MSTR — Signals + Liquidity · open full sizeFig. 8 MSTR — Delta + Technical · open full sizeMSTR — Unified OCS chart read
Executive Summary
The consensus bias is bullish, characterized by a pre-trigger participation state. While Chart 1 — Signals + Liquidity notes a temporary momentum weakness regime, Chart 2 — Delta + Technical provides high-conviction confirmation through positive liquidity bands, green CVD accumulation, and aligned fast/slow liquidity cycles. The setup awaits a structural breakout above the participation level to transition from observation to active trend-continuation.
OCS Confluence
Grade
Directional Bias
Participation State
high
bullish
pre-trigger
Setup Read: MSTR exhibits a bullish structural setup awaiting a trigger above 169.73, supported by strong delta accumulation and positive liquidity alignment.
Confirmations
Bullish Dominant Cycle alignment across both Chart 1 and Chart 2
Accumulation strength evidenced by green CVD (Chart 2) and a rising green ribbon (Chart 1)
Price maintaining position above key structural support/liquidity lines
Contradictions
Chart 1 identifies a 'momentum weakness regime' (pink band), while Chart 2 shows high conviction trend-continuation confluence
Levels To Watch
169.73 (Trigger Level - Chart 1)
169.12 (Stop/Invalidation - Chart 1)
165.92 (Key Confluence Level - Chart 2)
170.00-175.00 (Blue Float-Volume Zone - Chart 1)
139.54 (EMA 50 - Chart 2)
Invalidation
Structural failure occurs if price breaches the stop level of 169.12 (Chart 1).
Risk Notes
Current price resides within a momentum weakness band (Chart 1)
Potential for chop while price tests the 170-175 blue order block zone (Chart 1)
MSTR — Signals + Liquidity (click to expand)
Visible Context
Symbol
Timeframe
Layout Confidence
MSTR
1D
high
Signal Engine
Direction
Declaration
Trigger
Trigger Status
Stop / Invalidation
LONG
Strength Above
169.73
Not Triggered
169.12
Target Ladder
T1
T2
T3
T4
T5
Booked
Next Unbooked
N/A
N/A
N/A
N/A
N/A
None
N/A
Structure Context
Float-Volume Zones
Momentum Band
Dominant Cycle
Price Location
Structural Context
Price is currently inside/rejecting a blue above-average float-volume zone near 170-175
weakness; current price is situated within the pink momentum weakness band
bullish; green ribbon is rising beneath current price action
Price is below the trigger level of 169.73 and below the pink weakness band ceiling, but above the dominant cycle support
The setup is conflicting as price remains in a momentum weakness regime despite a bullish dominant cycle transition.
Setup Read
State
R:R to T1
R:R to Furthest
Invalidation
Evidence Quality
Notes
pre-trigger
N/A
N/A
Stop at 169.12
high
Price is trading within a pink weakness band but has recovered above the dominant-cycle ribbon and is currently testing a secondary blue order block zone.
MSTR — Delta + Technical (click to expand)
OCS Layout Presence
Delta Configuration Badge
Delta Histogram / CVD
Liquidity Overlay / Cycle
Ocs Ai Trader | Delta Configuration
green CVD columns in the bottom panel representing net buying accumulation
visible positive liquidity band (light teal) and stepped liquidity cycle lines on price
Liquidity Engine
Active Band
Vs Slow Liquidity
Vs Fast Liquidity
Cycle State
Divergence
Hands-Off Risk
positive liquidity band, price at high end
above slow positive line
above fast positive line
fast/slow cycle alignment (both positive)
none
low
Delta Engine
CVD Pressure
Dominant Cycle Leader
Adaptive Filter
Delta Force
Exhaustion Boundary
net buying
positive
bullish floor
absent
none
Secondary TA
EMA
RSI
MACD
EMA 150: 136.31, EMA 50: 139.54
RSI 14 close: 65.04 (purple), 64.00 (orange)
MACD 12 26 9: 10.21 (blue), 10.50 (orange)
Confluence
Setup Type
Directional Bias
Conviction
Confirmation
Contradiction
Key Level
trend-continuation long
bullish
high
Price is trading above both fast and slow positive liquidity lines within a positive liquidity band, supported by a positive dominant delta cycle and green CVD columns.
None visible.
165.92
* **Snapshot:** Price $164.55.
* **Analysis:** MSTR is acting as a high-beta proxy. The options chain shows massive put volume at the $85-$100 strikes, suggesting deep-out-of-the-money hedging.
* **Risk:** If the "Safety Premium" rotation continues, MSTR could see capital outflows as investors prefer the direct exposure of IBIT/FBTC.
SOL
Fig. 9 SOL — Signals + Liquidity · open full sizeFig. 10 SOL — Delta + Technical · open full sizeSOL — Unified OCS chart read
Executive Summary
The consensus direction is strongly bullish, characterized by a completed trend-continuation sequence that has moved into open space. While Chart 1 — Signals + Liquidity indicates the setup is currently 'exhausted' having cleared all historical T1-T5 targets, Chart 2 — Delta + Technical confirms robust participation through net buying accumulation in CVD and price trading above both fast and slow liquidity lines.
OCS Confluence
Grade
Directional Bias
Participation State
high
bullish
exhausted
Setup Read: SOL maintains a high-conviction bullish trend following the successful completion of all declared structural targets and continued net buying accumulation.
Confirmations
Bullish cycle alignment between the green ribbon in Chart 1 and the fast/slow liquidity cycles in Chart 2.
Price action is trending within positive momentum bands/liquidity bands across both analyses.
Absence of structural contradictions or delta divergences in both reads.
Contradictions
(none)
Levels To Watch
123.90 (Recent local resistance/swing high - Chart 2 — Delta + Technical)
Structural failure occurs if price breaches the primary stop level at 94.00 (Chart 1 — Signals + Liquidity).
Risk Notes
Price has entered 'open space' above all previous targets, increasing the potential for exhaustion (Chart 1).
Current state is classified as exhausted relative to the original signal declaration (Chart 1).
SOL — Signals + Liquidity (click to expand)
Visible Context
Symbol
Timeframe
Layout Confidence
SOLUSD: Solana / U.S. Dollar
1D
high
Signal Engine
Direction
Declaration
Trigger
Trigger Status
Stop / Invalidation
LONG
Strength Above
101.95
Triggered
94.00
Target Ladder
T1
T2
T3
T4
T5
Booked
Next Unbooked
104.88 (Booked)
107.25 (Booked)
109.88 (Booked)
117.78 (Booked)
122.60 (Booked)
T1, T2, T3, T4, T5
all booked
Structure Context
Float-Volume Zones
Momentum Band
Dominant Cycle
Price Location
Structural Context
Price is in open space above the blue zone (74.00-77.00) and gray zone (71.00-74.00).
strength (price is riding the upper edge of the green momentum band)
bullish (green ribbon supporting price action throughout the recent move)
Price is above all declared targets and the trigger, currently at 125.68.
The setup is clean as price has successfully cleared all structural levels and targets defined in the original declaration.
Setup Read
State
R:R to T1
R:R to Furthest
Invalidation
Evidence Quality
Notes
exhausted
N/A
N/A
Stop at 94.00
high
The price has exceeded all labeled strength targets, with T5 booked, transitioning into open space above the primary momentum band.
SOL — Delta + Technical (click to expand)
OCS Layout Presence
Delta Configuration Badge
Delta Histogram / CVD
Liquidity Overlay / Cycle
Ocs Ai Trader | Delta Configuration badge is visible in the center of the chart area.
Visible green CVD columns indicating net buying accumulation and green delta-force arrows at the bottom.
Visible positive liquidity band (green area) and fast/slow liquidity cycle lines overlaid on price.
Liquidity Engine
Active Band
Vs Slow Liquidity
Vs Fast Liquidity
Cycle State
Divergence
Hands-Off Risk
positive liquidity band, with price currently at the upper boundary of the recent bullish move
above slow positive liquidity line
above fast positive liquidity line
fast and slow cycle alignment (bullish)
none
low
Delta Engine
CVD Pressure
Dominant Cycle Leader
Adaptive Filter
Delta Force
Exhaustion Boundary
net buying
positive
bullish floor
recent green arrows
none
Secondary TA
EMA
RSI
MACD
EMA 14 close 119.33; EMA 50 close 116.33
RSI 14 close 63.07 | 44.58
MACD close 12 26 9 | -0.56 | 4.41 | 4.97
Confluence
Setup Type
Directional Bias
Conviction
Confirmation
Contradiction
Key Level
trend-continuation long
bullish
high
Price is trending within a positive liquidity band supported by a positive dominant delta cycle and consistent net buying accumulation in the CVD columns.
None visible.
123.90 (recent local resistance/swing high)
* **Snapshot:** No stock data provided.
* **Analysis:** As a high-beta altcoin, SOL is the most vulnerable to the "liquidity drainage" effect. If prime brokers deleverage due to higher borrowing costs (DXY strengthening), SOL is a likely candidate for forced selling.
Historical Parallels
The current regulatory environment mirrors the period leading up to the 2024 Tornado Cash sanctions, where the market experienced a sharp bifurcation between "compliant" and "anonymity-focused" assets. The key difference today is the maturity of the ETF infrastructure (IBIT/FBTC), which acts as a "flight-to-quality" destination that didn't exist in previous cycles.
Outlook & Risk Matrix
Short-Term (1-5 Days)
Market Sentiment: Cautious. Expect heightened volatility in alt-coins as the market digests the ZEC ETF filing and its implications for privacy-centric assets.
Key Levels: Watch BTC $38.33 (Breakout) and $37.07 (Support).
Scenario: Base case is consolidation as the market waits for further SEC commentary on the ZEC filing.
Medium-Term (1-4 Weeks)
Market Sentiment: Bifurcated. The "Safety Premium" will likely continue to favor IBIT/FBTC/ETHE.
Key Levels: Monitor COIN's ability to hold the $180 support level. A break below this would confirm the "regulatory risk premium" thesis.
Scenario: Bullish for BTC/ETH ETFs; Bearish/Neutral for alt-coins and crypto-proxies.
What to Watch
SEC Commentary on ZEC ETF: Any language regarding "privacy features" will be the primary driver of volatility.
Stablecoin Liquidity: Further freezes or regulatory actions similar to the Conduit/Tether case will tighten liquidity for DeFi pairs.
DXY Strength: A continued rise in the DXY will likely act as a headwind for all crypto assets, particularly SOL and other high-beta alt-coins.
Institutional Flows: Monitor the spread between BTC spot and IBIT premium. A widening premium would suggest strong institutional demand despite the regulatory noise.
Education and market research only, not financial advice. Charts are OCS AI Trader readings at the time of writing and change with new bars.