The Eurozone Collateral Crunch: Liquidity Tightening and the Global Carry Unwind
Executive summary
The European Central Bank’s (ECB) announcement regarding the adjustment of monetary policy implementation guidelines—specifically targeting collateral eligibility for bank bonds and corporate assets—has introduced a structural liquidity shock to the Eurozone. This is not merely a policy tweak; it is a plumbing adjustment that threatens to tighten credit conditions, widen corporate spreads, and force a massive deleveraging of EUR-funded carry trades. As European institutions scramble to optimize balance sheets ahead of the November 30, 2026 implementation, the resulting capital flight is fueling a rotation into USD-denominated safe havens and triggering a reflexive appreciation in the Japanese Yen (JPY), creating a non-obvious feedback loop that overrides standard interest-rate differentials.
Layer 1: The Plumbing Shock (Direct Impacts)
The ECB’s decision to modify collateral eligibility criteria for unsecured bank bonds, covered bank bonds, and non-financial corporate assets is the primary catalyst. By reducing the "high-quality" status of these instruments, the ECB is effectively increasing the haircut requirements for repo market participants.
This creates an immediate liquidity trap: European financial institutions holding these assets must now either source higher-quality collateral (such as sovereign bonds) or face increased funding costs. This is directly pressuring the Euro (FXE), as the liquidity utility of the currency—and the assets denominated in it—is being systematically degraded. The immediate volatility in European financial sector debt (XLF) is a symptom of this repricing, as the market begins to discount the increased cost of balance sheet maintenance for major Eurozone banks.
Fig. 1 FXE — Signals + Liquidity · open full sizeFig. 2 FXE — Delta + Technical · open full sizeFXE — Unified OCS chart read
Executive Summary
The consensus view is a high-conviction bearish trend-continuation. Price has moved aggressively through the 107.81 trigger (Chart 1 — Signals + Liquidity) and is currently navigating a high-velocity sell-off characterized by net selling in the CVD and red delta-force arrows (Chart 2 — Delta + Technical). The setup remains structurally intact as price sits in open space below primary float-volume zones and is testing fast negative liquidity lines (Chart 2 — Delta + Technical).
OCS Confluence
Grade
Directional Bias
Participation State
high
bearish
exhausted
Setup Read: FXE exhibits high-conviction bearish momentum as price trades in open space below the primary trigger and maintains alignment between negative delta cycles and downward structural flow.
Confirmations
Price is trading well below the primary structural trigger of 107.81 (Chart 1 — Signals + Liquidity).
Aggressive bearish momentum is supported by net selling in CVD and red delta-force arrows (Chart 2 — Delta + Technical).
Structural weakness is confirmed by price trading within the pink momentum band and a negative dominant delta cycle (Chart 1 & Chart 2).
Structural failure occurs if price recovers above the 107.81 trigger level (Chart 1 — Signals + Liquidity).
Risk Notes
Exhaustion risk as RSI 14 is currently at 22.63 (Chart 2 — Delta + Technical).
Price is currently in an 'exhausted' state relative to the initial signal move (Chart 1 — Signals + Liquidity).
FXE — Signals + Liquidity (click to expand)
Visible Context
Symbol
Timeframe
Layout Confidence
FXE
1D
high
Signal Engine
Direction
Declaration
Trigger
Trigger Status
Stop / Invalidation
SHORT
Weakness Below
107.81
Triggered
107.81
Target Ladder
T1
T2
T3
T4
T5
Booked
Next Unbooked
107.47
107.27
107.15
106.76
106.56
None
T1 at 107.47
Structure Context
Float-Volume Zones
Momentum Band
Dominant Cycle
Price Location
Structural Context
Price is currently rejecting the red extreme float-volume zone at the top of the recent move and sits below the blue secondary order block.
weakness with price trading within the pink momentum band
bearish with steep pink ribbon pressure
Price is currently at 103.91, well below the trigger (107.81) and all T1-T5 targets.
The setup is clean as price has moved aggressively through the weakness declaration and is currently in open space below the primary float-volume zones.
Setup Read
State
R:R to T1
R:R to Furthest
Invalidation
Evidence Quality
Notes
exhausted
N/A
N/A
Stop at 107.81
high
The current price is rejecting the pink weakness band and the red extreme float-volume zone, while trading below the recent trigger level.
FXE — Delta + Technical (click to expand)
OCS Layout Presence
Delta Configuration Badge
Delta Histogram / CVD
Liquidity Overlay / Cycle
Ocs Ai Trader | Delta Configuration
Red CVD columns showing net selling and red delta-force arrows.
Negative (pink/red) liquidity band with fast and slow liquidity lines.
Liquidity Engine
Active Band
Vs Slow Liquidity
Vs Fast Liquidity
Cycle State
Divergence
Hands-Off Risk
negative, with price currently at the lower edge of the band near 103.76
below slow negative line
at fast negative line
fast/slow cycle alignment (bearish)
none
low
Delta Engine
CVD Pressure
Dominant Cycle Leader
Adaptive Filter
Delta Force
Exhaustion Boundary
net selling
negative
bearish ceiling
red delta-force arrows
none
Secondary TA
EMA
RSI
MACD
EMA 51 at 105.45
RSI 14 close at 22.63
MACD 12 26 9 (negative)
Confluence
Setup Type
Directional Bias
Conviction
Confirmation
Contradiction
Key Level
trend-continuation short
bearish
high
Price is currently testing a fast negative liquidity line within a negative liquidity band, coinciding with a negative dominant delta cycle and red CVD columns.
None visible.
103.76 (recent price pivot/resistance area)
Layer 2: Secondary Effects and Sector Rotation
The ripple effects of this collateral squeeze are propagating through credit markets. We are observing a widening of corporate credit spreads in the Eurozone. As the utility of corporate bonds as collateral diminishes, issuers are forced to offer higher yields to attract liquidity, a dynamic that inherently pressures the EURUSD.
This creates a clear incentive for sector rotation. European financial equities are facing a dual headwind: compressed net interest margins from higher funding costs and the necessity of capital reallocation. We are seeing early signs of institutional capital flight from European financials into US-denominated assets. This is not just a search for yield; it is a search for collateral quality. Institutional investors are shifting holdings toward US Treasury-backed instruments (UUP), reinforcing the DXY’s structural strength despite the potential for an overbought RSI reading.
Layer 3: Macro Propagation and Global Liquidity
The most significant macro propagation is the forced deleveraging of EUR-funded carry trades. For months, the market has operated on the assumption of stable EUR-funded carry. The ECB’s policy shift breaks this. As Eurozone repo markets tighten, investors are forced to unwind these carry positions.
The immediate beneficiary is the Japanese Yen (JPY). Unlike standard market movements where JPY strength is tied to Bank of Japan (BoJ) policy or US rate cuts, this is a forced repatriation event. Capital is flowing back into the JPY as a funding and safe-haven currency, causing an appreciation that is largely decoupled from interest-rate differentials.
Simultaneously, we are seeing pressure on Emerging Market (EM) currencies, such as the Indian Rupee (USDINR). As FIIs face margin calls or liquidity requirements in the Eurozone, they are liquidating EM equity positions to raise cash. This "liquidity drain" creates a temporary, non-fundamental decoupling where EM assets fall in tandem with the EUR, providing a potential entry point for long-term investors once the liquidity shock stabilizes.
Layer 4: Non-Obvious Cross-Connections
The most critical insight is the Collateral-Carry Feedback Loop. The ECB’s tightening forces a reduction in EUR-funded carry, which necessitates JPY repatriation. This JPY strength forces further carry unwinds, creating a self-reinforcing loop that can overwhelm traditional macro signals. This is a short squeeze on the Yen that ignores US rate policy.
Furthermore, we are witnessing a Semiconductor Onshoring Hedge. As European industrial firms face margin compression due to the credit squeeze, capital is rotating into US-listed semiconductor ETFs (SMH) and major players like TSM and NVDA. These assets are acting as a "safe haven" for growth capital, effectively insulating US tech from the Eurozone's industrial stagnation.
Finally, Gold (GLD/GC) is emerging as the ultimate collateral substitute. As corporate bonds lose their status as "high-quality" collateral, institutional demand for non-sovereign, highly liquid assets is shifting toward gold. This is creating an inverse correlation between EURUSD and Gold that is likely to strengthen as we approach the November 30 implementation date.
Unified OCS Chart Read
Note: OCS chart capture is currently in the asynchronous repair queue. The following analysis utilizes quantitative data provided in the live market snapshot.
EURUSD: The pair is under structural pressure. While FXE shows an RSI(14) of 22.37 (deeply oversold), the fundamental catalyst—the ECB collateral overhaul—suggests that price may remain depressed or consolidate rather than bounce. The 1.08 level remains a critical pivot; a break below suggests a move toward deeper structural lows.
DXY/UUP: The UUP RSI(14) of 72.55 indicates the index is significantly overbought. While the "collateral magnet" theory supports USD strength, the technicals suggest a high probability of a short-term pullback or consolidation. We are looking for a break above the 29.05 Bollinger band to confirm a new leg higher, or a retreat to the 28.43 SMA level.
USDJPY/FXY: The FXY RSI(14) of 47.48 is neutral, but the price action is reflecting the carry unwind. We are monitoring the 150.00 level as a key psychological barrier. The "Collateral-Carry Feedback Loop" suggests that JPY strength is driven by forced repatriation, making technical resistance levels less reliable than in standard interest-rate-driven regimes.
XLI/HG: The industrial metal dislocation is evident. HG is trading at 34.13. The margin compression for European industrials (XLI) suggests that copper demand may remain soft, contradicting the price bounce seen in the last 24 hours. This is a potential false signal for global industrial demand.
Security-by-Security Analysis
EURUSD
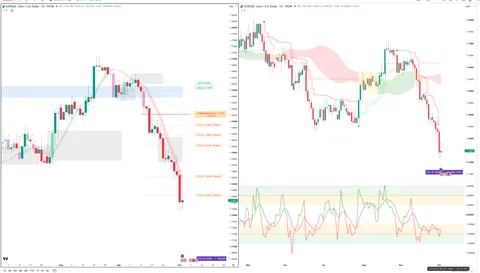
Fig. 3 EURUSD — Signals + Liquidity · open full sizeFig. 4 EURUSD — Delta + Technical · open full sizeEURUSD — Unified OCS chart read
Executive Summary
The consensus outlook is a high-conviction bearish trend-continuation. Chart 1 — Signals + Liquidity establishes a 'Weakness Below' declaration with price currently descending through sequential targets, while Chart 2 — Delta + Technical confirms this via net selling CVD pressure and a negative delta cycle. The participation state is active, characterized by price moving through open space following rejection of an extreme volume zone.
OCS Confluence
Grade
Directional Bias
Participation State
high
bearish
active
Setup Read: EURUSD exhibits a high-conviction bearish structure as price moves through weakness bands supported by negative delta force and net selling CVD.
Confirmations
Chart 1 signal (Weakness Below) is structurally reinforced by Chart 2's net selling CVD pressure.
Both charts indicate a bearish regime: Chart 1's pink weakness band aligns with Chart 2's negative dominant cycle leader.
Liquidity alignment: Chart 1's descent through open space is corroborated by Chart 2's position below both fast and slow negative liquidity lines.
Contradictions
(none)
Levels To Watch
1.15353 (Trigger - Chart 1)
1.13951 (Stop / Invalidation - Chart 1)
1.12800 (Key Confluence Level - Chart 2)
1.12641 (Next Unbooked Target T5 - Chart 1)
Invalidation
Structural failure occurs upon a breach of the 1.13951 invalidation level (Chart 1 — Signals + Liquidity).
Risk Notes
Price is currently in open space below secondary order blocks, increasing the potential for momentum acceleration or rapid exhaustion.
Low hands-off risk per Chart 2's liquidity engine assessment.
EURUSD — Signals + Liquidity (click to expand)
Visible Context
Symbol
Timeframe
Layout Confidence
EURUSD - Euro / U.S. Dollar 1D - FXCM
1D
high
Signal Engine
Direction
Declaration
Trigger
Trigger Status
Stop / Invalidation
SHORT
Weakness Below
1.15353
Triggered
1.13951
Target Ladder
T1
T2
T3
T4
T5
Booked
Next Unbooked
1.14894 (Booked)
1.14598 (Booked)
1.14258 (Booked)
1.13346
1.12641
T1, T2, T3
T5 at 1.12641
Structure Context
Float-Volume Zones
Momentum Band
Dominant Cycle
Price Location
Structural Context
Price is currently in open space below the blue secondary order block and the pink extreme volume zone.
weakness; price is trading within the pink weakness band
bearish; price is trending downward through the pink negative cycle ribbon
Price is below the trigger (1.15353) and stop (1.13951), currently approaching unbooked targets T4 and T5.
The setup is clean, characterized by price rejecting a red extreme volume zone and moving through sequential targets within a weakness regime.
Setup Read
State
R:R to T1
R:R to Furthest
Invalidation
Evidence Quality
Notes
active
N/A
N/A
Stop at 1.13951
high
Price is currently within a pink weakness band and descending from a red extreme volume zone, following a Weakness Below declaration.
EURUSD — Delta + Technical (click to expand)
OCS Layout Presence
Delta Configuration Badge
Delta Histogram / CVD
Liquidity Overlay / Cycle
Ocs Ai Trader | Delta Configuration
Visible CVD histogram with red columns and green delta-force arrows (top) and red delta-force arrows (bottom); recent red columns predominate.
N/A
Liquidity Engine
Active Band
Vs Slow Liquidity
Vs Fast Liquidity
Cycle State
Divergence
Hands-Off Risk
negative
below slow negative liquidity line
below fast negative liquidity line
fast/slow cycle alignment (negative)
none
low
Delta Engine
CVD Pressure
Dominant Cycle Leader
Adaptive Filter
Delta Force
Exhaustion Boundary
net selling
negative
bearish ceiling
recent red arrows
none
Secondary TA
EMA
RSI
MACD
Two EMAs visible (red/blue)
RSI visible (14 close)
MACD visible (histogram and lines)
Confluence
Setup Type
Directional Bias
Conviction
Confirmation
Contradiction
Key Level
trend-continuation short
bearish
high
Price is within a negative liquidity band supported by a negative dominant delta cycle and red CVD columns.
None visible.
1.12800
* **Thesis:** Structural bearishness driven by liquidity contraction.
* **Levels to Watch:** 1.08 (Support/Pivot).
* **Risk:** Deeply oversold (FXE RSI 22.37) creates potential for a short-covering rally if ECB officials attempt to jawbone the market.
* **Causal Chain:** ECB Collateral Rules → Repo Liquidity Squeeze → EUR Depreciation → Capital Flight to USD.
USDJPY
Fig. 5 USDJPY — Signals + Liquidity · open full sizeFig. 6 USDJPY — Delta + Technical · open full sizeUSDJPY — Unified OCS chart read
Executive Summary
The current USDJPY landscape presents a divergence between historical price exhaustion and real-time delta participation. While Chart 1 — Signals + Liquidity notes the exhaustion of previous upside moves and a retracement through momentum weakness zones, Chart 2 — Delta + Technical shows active net buying pressure and alignment within a positive liquidity band. The consensus focuses on whether recent delta accumulation can overcome the structural momentum weakness identified in the higher-timeframe cycle.
OCS Confluence
Grade
Directional Bias
Participation State
medium
bullish
active
Setup Read: USDJPY is currently navigating a period of delta-driven accumulation within positive liquidity bands despite historical momentum exhaustion and recent retracement through key structural zones.
Confirmations
Price is currently situated in a zone of net buying accumulation (Chart 2 — Delta + Technical).
Price action is interacting with liquidity bands while maintaining position above primary structural support (Chart 2 — Delta + Technical).
Contradictions
Chart 1 — Signals + Liquidity identifies price as 'exhausted' within a pink momentum weakness band following historical target completion, whereas Chart 2 — Delta + Technical signals a 'trend-continuation long' with positive liquidity alignment.
Structural failure occurs upon a breach of the catastrophic stop at 154.056 (Chart 1 — Signals + Liquidity).
Risk Notes
High-level exhaustion noted following completion of T1-T4 targets (Chart 1 — Signals + Liquidity).
Price is oscillating within a pink momentum weakness band (Chart 1 — Signals + Liquidity).
Potential for chop as delta-driven buying meets historical structural resistance (Chart 1 & 2 synthesis).
USDJPY — Signals + Liquidity (click to expand)
Visible Context
Symbol
Timeframe
Layout Confidence
USDJPY - U.S. Dollar / Japanese Yen 1D
1D
high
Signal Engine
Direction
Declaration
Trigger
Trigger Status
Stop / Invalidation
LONG
Strength Above
155.236
Triggered
154.056
Target Ladder
T1
T2
T3
T4
T5
Booked
Next Unbooked
155.751 (Booked)
156.249 (Booked)
156.753 (Booked)
158.272 (Booked)
159.196
T1, T2, T3, T4
T5 at 159.196
Structure Context
Float-Volume Zones
Momentum Band
Dominant Cycle
Price Location
Structural Context
rejecting pink extreme zone at ~159.500-160.000 and trading near pink/red zone at ~158.000
weakness: price is oscillating within the pink momentum weakness band
bearish: pink ribbon is active below price action
Price is below the trigger (155.236) and targets, but above the catastrophic stop (154.056)
The setup shows historical upside completion with price now retracing through pink momentum and cycle pressure zones.
Setup Read
State
R:R to T1
R:R to Furthest
Invalidation
Evidence Quality
Notes
exhausted
N/A
N/A
Stop at 154.056
high
Price is currently rejecting a pink extreme float-volume zone and is trading within a pink momentum weakness band, following a series of booked upside targets.
USDJPY — Delta + Technical (click to expand)
OCS Layout Presence
Delta Configuration Badge
Delta Histogram / CVD
Liquidity Overlay / Cycle
Ocs Ai Trader | Delta Configuration badge visible in center-bottom of chart area
Green CVD columns and green delta-force arrows visible at bottom panel
Visible colored liquidity bands (green/red/blue) and stepped liquidity lines on price chart
Liquidity Engine
Active Band
Vs Slow Liquidity
Vs Fast Liquidity
Cycle State
Divergence
Hands-Off Risk
positive liquidity band with latest price at 157.681
above slow positive line
above fast positive line
fast/slow cycle alignment
none
low
Delta Engine
CVD Pressure
Dominant Cycle Leader
Adaptive Filter
Delta Force
Exhaustion Boundary
net buying
positive
bullish floor
recent green arrows
none
Secondary TA
EMA
RSI
MACD
EMA 10: 157.971, EMA 1: 157.681
RSI 14 close: 51.99 51.36
MACD close 12 26 9: 0.041 -0.210
Confluence
Setup Type
Directional Bias
Conviction
Confirmation
Contradiction
Key Level
trend-continuation long
bullish
medium
Price is currently trading within a positive liquidity band with recent green CVD columns indicating net buying accumulation.
None visible
157.000
* **Thesis:** Forced repatriation driven by carry trade unwinds.
* **Levels to Watch:** 150.00 (Psychological/Technical).
* **Risk:** The "Collateral-Carry Feedback Loop" creates a risk of a violent, non-linear move if the unwind accelerates.
* **Causal Chain:** ECB Policy → EUR Liquidity Drain → EUR-Funded Carry Unwind → JPY Repatriation.
DXY
Fig. 7 DXY — Signals + Liquidity · open full sizeFig. 8 DXY — Delta + Technical · open full sizeDXY — Unified OCS chart read
Executive Summary
The DXY is currently in a high-stakes transition phase, testing a bullish trend-continuation setup at 101.855 (Chart 2). While Chart 2 — Delta + Technical shows positive liquidity engagement above both slow and fast liquidity lines, Chart 1 — Signals + Liquidity warns of a 'conflicting' state as price rejects extreme float-volume resistance within a pink momentum weakness band. The consensus suggests a bullish bias that is currently encountering significant structural friction.
OCS Confluence
Grade
Directional Bias
Participation State
medium
bullish
unclear
Setup Read: DXY is testing a bullish liquidity breakout against significant float-volume resistance and momentum weakness.
Confirmations
Price is navigating a critical junction at the 101.85-101.95 zone (Chart 1 & Chart 2)
Bullish liquidity posture is being tested by momentum-based resistance (Chart 1 & Chart 2)
Contradictions
Chart 2 indicates a bullish trend-continuation setup, while Chart 1 identifies a conflicting setup due to testing resistance within a pink weakness band
101.945: Current Price Location/Weakness Band (Chart 1)
100.851: Catastrophic Stop Level (Chart 1)
100.000: Primary Support Zone (Chart 1)
Invalidation
Structural failure occurs if price breaches the catastrophic stop level at 100.851 (Chart 1).
Risk Notes
Exhaustion risk at the upper boundary of the pink momentum weakness band (Chart 1)
Conflicting structural signals between liquidity support and momentum resistance (Chart 1)
Low hands-off risk due to high-level testing (Chart 2)
DXY — Signals + Liquidity (click to expand)
Visible Context
Symbol
Timeframe
Layout Confidence
DXY - U.S. Dollar Index
1D
high
Signal Engine
Direction
Declaration
Trigger
Trigger Status
Stop / Invalidation
NEUTRAL
no visible declaration
N/A
N/A
N/A
Target Ladder
T1
T2
T3
T4
T5
Booked
Next Unbooked
N/A
N/A
N/A
N/A
N/A
None
N/A
Structure Context
Float-Volume Zones
Momentum Band
Dominant Cycle
Price Location
Structural Context
Price is currently rejecting a pink (extreme float-volume) resistance zone near 101.851 and navigating open space above the primary 100.000 support zone.
mixed; price is currently oscillating within a pink weakness band near the recent local peak
stabilizing; the ribbon shows flattening/transitioning behavior between green and pink cycles
Price is currently at 101.945, positioned above the primary gray float-volume reference and within a pink momentum weakness band.
The setup is conflicting as price is testing resistance within a weakness band despite recent bullish price action.
Setup Read
State
R:R to T1
R:R to Furthest
Invalidation
Evidence Quality
Notes
unclear
N/A
N/A
Catastrophic stop level at 100.851
high
Price is currently testing the upper boundary of a pink weakness band within a regime of stabilizing cycle ribbons and historical float-volume rejection.
DXY — Delta + Technical (click to expand)
OCS Layout Presence
Delta Configuration Badge
Delta Histogram / CVD
Liquidity Overlay / Cycle
Ocs Ai Trader | Delta Configuration
N/A
visible liquidity bands and stepped liquidity lines
Liquidity Engine
Active Band
Vs Slow Liquidity
Vs Fast Liquidity
Cycle State
Divergence
Hands-Off Risk
positive with price at upper edge
above slow positive liquidity line
above fast positive liquidity line
N/A
none
low
Delta Engine
CVD Pressure
Dominant Cycle Leader
Adaptive Filter
Delta Force
Exhaustion Boundary
N/A
N/A
N/A
N/A
N/A
Secondary TA
EMA
RSI
MACD
EMA 9 and EMA 21 visible
RSI 14 visible
MACD 12 26 9 visible
Confluence
Setup Type
Directional Bias
Conviction
Confirmation
Contradiction
Key Level
trend-continuation long
bullish
medium
Price is trading above the slow positive liquidity line and within a positive liquidity band.
None visible.
101.855
* **Thesis:** Beneficiary of the "Collateral Magnet" effect.
* **Levels to Watch:** 29.05 (Bollinger Upper Band).
* **Risk:** Overbought RSI (72.55) suggests the move is extended.
* **Causal Chain:** Eurozone Liquidity Vacuum → Demand for US Treasury Collateral → DXY Strength.
HG (Copper)
Fig. 9 HG — Signals + Liquidity · open full sizeFig. 10 HG — Delta + Technical · open full sizeHG — Unified OCS chart read
Executive Summary
The consensus outlook is bearish, as price maintains a clear weakness declaration below the 4.85 trigger (Chart 1). While three targets have been successfully booked, the setup is currently in an exhausted state, with price testing the intersection of the next unbooked target (T4 at 3.58) and the fast negative liquidity line (Chart 2). Stronger delta-force selling and red extreme float-volume rejection at 5.50-5.60 reinforce the prevailing negative momentum.
OCS Confluence
Grade
Directional Bias
Participation State
medium
bearish
exhausted
Setup Read: HG maintains a bearish trend-continuation structure with price currently testing liquidity boundaries and the final unbooked target tier.
Confirmations
Consensus bearish direction supported by Chart 1's weakness declaration and Chart 2's net selling CVD pressure.
Price action is confirmed within a negative cycle, with Chart 1 noting a pink negative cycle ribbon and Chart 2 noting fast/slow cycle alignment in a descending state.
Price is currently testing critical downside boundaries, specifically the T4 target (3.58) in Chart 1 and the fast negative liquidity line in Chart 2.
Contradictions
(none)
Levels To Watch
4.85 (Trigger - Chart 1)
3.58 (Next Unbooked Target T4 - Chart 1)
3.55 (Recent Swing Low - Chart 2)
3.54 (Stop / Invalidation - Chart 1)
5.50-5.60 (Extreme Float-Volume Resistance Zone - Chart 1)
Fast Negative Liquidity Line (Chart 2)
Invalidation
Structural failure occurs if price breaches the stop level at 3.54 (Chart 1).
Risk Notes
Medium hands-off risk due to price testing the fast negative liquidity line boundary (Chart 2).
Exhaustion risk as the setup is currently described as exhausted (Chart 1).
HG — Signals + Liquidity (click to expand)
Visible Context
Symbol
Timeframe
Layout Confidence
HG
1D
high
Signal Engine
Direction
Declaration
Trigger
Trigger Status
Stop / Invalidation
SHORT
Weakness Below
4.85
Triggered
3.54
Target Ladder
T1
T2
T3
T4
T5
Booked
Next Unbooked
4.64 (Booked)
4.45 (Booked)
4.22 (Booked)
3.58
3.20
T1, T2, T3
T4 at 3.58
Structure Context
Float-Volume Zones
Momentum Band
Dominant Cycle
Price Location
Structural Context
Price is rejecting a red extreme float-volume zone located near 5.50-5.60.
weakness; price is trading within the pink weakness momentum band
bearish; pink ribbon indicates active negative cycle pressure
Price is below the trigger (4.85) and below all booked targets, currently approaching the next unbooked target (T4) and the stop (3.54).
The setup is clean as price has respected the weakness declaration, booked three targets, and is currently reacting to extreme volume resistance.
Setup Read
State
R:R to T1
R:R to Furthest
Invalidation
Evidence Quality
Notes
exhausted
N/A
N/A
Stop at 3.54
high
Price is currently rejecting a red extreme float-volume zone while trading within a pink weakness momentum band and a pink negative cycle ribbon.
HG — Delta + Technical (click to expand)
OCS Layout Presence
Delta Configuration Badge
Delta Histogram / CVD
Liquidity Overlay / Cycle
Ocs Ai Trader | Delta Configuration
Red and green CVD columns with recent heavy red selling columns and red delta-force arrows
Stepped liquidity lines (fast and slow) and shaded liquidity bands
Liquidity Engine
Active Band
Vs Slow Liquidity
Vs Fast Liquidity
Cycle State
Divergence
Hands-Off Risk
negative liquidity band with price currently at the lower edge
below slow negative liquidity line
below fast negative liquidity line
fast/slow cycle alignment (both descending)
none
medium due to price testing the fast negative liquidity line boundary
Delta Engine
CVD Pressure
Dominant Cycle Leader
Adaptive Filter
Delta Force
Exhaustion Boundary
net selling
negative
N/A
recent red arrows
none
Secondary TA
EMA
RSI
MACD
EMA 9 (blue) and EMA 21 (orange) visible
RSI 14 visible in middle panel
MACD visible in lower panel
Confluence
Setup Type
Directional Bias
Conviction
Confirmation
Contradiction
Key Level
trend-continuation short
bearish
low
Price is testing the fast negative liquidity line while CVD shows significant recent net selling accumulation.
None visible.
3.55 (recent swing low/price)
* **Thesis:** Dislocated from global industrial reality due to European financing costs.
* **Levels to Watch:** 32.66 (Bollinger Lower Band).
* **Risk:** Price action is currently driven by European financing costs, not global industrial demand.
* **Causal Chain:** European Margin Compression → Reduced Industrial Output → Lower Copper Demand.
Historical Parallels
The current ECB policy shift mirrors the liquidity-tightening phases of 2011-2012, where collateral valuation changes exacerbated the Eurozone sovereign debt crisis. However, the modern "Carry-Collateral Feedback Loop" is more similar to the 2008 liquidity crunch, where the sudden evaporation of repo collateral forced a global deleveraging event. The key difference today is the role of the JPY as the primary funding currency, which was not the case in 2008. Investors should look to the 2020 "dash for cash" for the speed of the USD rotation, though the current trigger is policy-driven rather than pandemic-driven.
Outlook and Risk Matrix
Short-Term (1-5 Days)
Expect heightened volatility in EUR crosses. The market will likely test the 1.08 level in EURUSD. The USD will likely remain bid, though an overbought RSI suggests we may see a "buy the rumor, sell the news" reaction if no further hawkish signals emerge.
Medium-Term (1-4 Weeks)
The focus shifts to the November 30 implementation date. We expect a structural widening of Eurozone credit spreads. The carry trade unwind will likely continue, keeping the JPY bid. We anticipate a "bifurcated market" where US tech (SMH) outperforms while European industrials (XLI) lag.
Risk Matrix
Bull Case (EUR): ECB pauses the implementation or offers a "liquidity backstop" for corporate bonds, easing the collateral crunch.
Base Case: Gradual tightening, continued EUR weakness, and persistent JPY strength.
Bear Case: A "liquidity accident" in the European repo market forces an emergency ECB intervention, causing a massive, volatile reversal in EURUSD.
What to Watch
Repo Market Rates: Any spike in overnight Eurozone repo rates will confirm the "collateral crunch" thesis.
EURUSD 1.08: A sustained break below this level is the signal for a deeper, structural move.
JPY Crosses: Monitor the speed of JPY appreciation. If it becomes parabolic, it signals a systemic unwind of carry trades rather than a standard market move.
US Treasury Yields: If TLT outperforms despite DXY strength, it confirms the "Collateral Magnet" effect where Treasuries are being bought for their collateral utility, not their yield.
Education and market research only, not financial advice. Charts are OCS AI Trader readings at the time of writing and change with new bars.