Houthi Escalation: The Energy Risk Premium Returns and the 'Energy-Dollar-India' Feedback Loop
Executive summary
The global macro landscape has shifted overnight as the geopolitical risk premium in energy markets has transitioned from a theoretical concern to a concrete, operational reality. A sustained, near-daily campaign of Houthi missile and drone attacks targeting critical Saudi infrastructure—including Aramco facilities in Riyadh and the Eastern Province—has forced an immediate re-pricing of energy supply risk.
This development is not merely an isolated geopolitical incident; it is a catalyst for a multi-layer cascading impact. We are witnessing an immediate flight-to-safety in the US Dollar and a sharp contraction in equity indices (ES, NQ, RTY) as the market digests the dual threat of energy-induced inflation and margin compression. Most critically, this shock is activating a non-obvious "Energy-Dollar-India" feedback loop, where oil import dependencies in emerging markets are forcing liquidity drains that threaten to exacerbate global equity volatility.
The Layered Impact Chain
Layer 1: Direct Impacts (The Supply Shock)
The immediate market reaction is a classic supply-side risk premium injection. The targeting of Saudi infrastructure (Riyadh, Eastern Province, and southern regions) by Houthi forces has moved beyond posturing.
- Energy Benchmarks: CL (WTI) and BRENT are seeing immediate upward pressure, not just on current spot prices but along the term structure as traders price in the potential for sustained infrastructure damage.
- Equities: ES, NQ, and RTY are facing a "risk-off" liquidation. The immediate correlation is a sharp divergence between energy-linked assets (XLE) and growth/tech-heavy indices (NQ).
- Volatility: VXX and UVXY are seeing increased demand as institutional desks hedge against the potential for a "gap-down" opening in the event of further escalations in the Strait of Hormuz or against Saudi energy facilities.
Layer 2: Secondary Effects (Margin Compression)
As energy prices rise, the structural impact on downstream industries is becoming clear.
- Industrial Margin Compression: Sectors heavily dependent on energy inputs—specifically transportation (XLI) and consumer discretionary (XLY)—are facing immediate margin pressure. The market is beginning to rotate out of these sectors, anticipating that input costs will rise faster than companies can pass them on to consumers.
- Defensive Rotation: We are seeing a move away from high-beta tech into defensive, cash-flow-generative energy equities (XLE). However, this rotation is becoming "trapped" because the broader market beta (ES) is contracting due to the same energy shock that is boosting XLE.
Layer 3: Macro Propagation (The Inflationary Feedback)
The macro propagation is where the situation becomes systemic.
- Inflation Expectations: The rise in energy costs is reinforcing the "higher-for-longer" narrative for the Fed. Even as equities sell off, the 2Y yield (US2Y) is finding a floor, preventing the typical "pivot" trade that usually supports growth stocks during market turbulence.
- Emerging Market Stress: The most significant macro spillover is the pressure on emerging markets with high oil import dependency, most notably India. The combination of a stronger DXY (as a flight-to-safety hedge) and higher oil prices is creating a "double-whammy" for the Indian Rupee (USDINR) and domestic equities (NIFTY/BANKNIFTY).
Layer 4: Non-Obvious Cross-Connections (The Feedback Loops)
This is where institutional alpha is found. We have identified three critical non-obvious connections:
- The 'Energy-Dollar-India' Feedback Loop: As oil prices rise and the DXY strengthens, India’s trade deficit widens. The RBI is forced to intervene to stabilize the Rupee, draining domestic liquidity. This liquidity drain forces selling in liquid proxies like RELIANCE, which drags down the NIFTY index, creating a self-reinforcing downward spiral that operates independently of the initial geopolitical news.
- The 'Energy-Defensive' Rotation Trap: Investors rotating into XLE to hedge inflation are finding that the resulting demand destruction in consumer discretionary (XLY) leads to a broader market beta contraction. The hedge is being neutralized by the very market decline it was meant to offset.
- Semiconductor 'Double-Whammy': Energy-intensive semiconductor fabrication costs are rising, squeezing margins. Simultaneously, the DXY spike is creating a valuation headwind for non-US domiciled tech (TSM), causing a divergence between US-based chip designers and Asian foundries that will likely persist until energy volatility stabilizes.
Unified OCS Chart Read
Note: OCS chart evidence for ES, BRENT, XLE, and NQ is currently deferred to the asynchronous repair queue. The following analysis is derived from macro-thematic and fundamental data. Once the OCS vision engine completes the enrichment, this section will be updated with specific liquidity, delta, and signal-candle reconciliations.
Setup Read: The market is currently in a "geopolitical gap" regime. Technical indicators on ES (RSI 47.59) and NQ (RSI 43.59) suggest the market is not yet oversold, implying that the current drawdown has room to run if the energy risk premium continues to expand.
Levels To Watch:
- ES: The 7600 level is a critical psychological and technical pivot. A sustained break below this level on volume would likely signal a capitulation phase.
- CL: $86.00 remains the key support-turned-resistance. A sustained hold above this level confirms the new "risk premium" baseline.
Invalidation: If the Saudi-led coalition announces a successful neutralization of the Houthi drone threat or a diplomatic ceasefire, look for a rapid "mean reversion" trade. The risk premium would likely evaporate within 48-72 hours, leading to a violent short-squeeze in NQ and RTY.
Risk Notes: The current market is underpricing the systemic risk of the "Energy-Dollar-India" feedback loop. If the Rupee continues to depreciate, expect correlated selling in global EM-proxies.
Security-by-Security Analysis
S&P 500 Futures (ES)
- Snapshot: Trading at 7613.25 (-1.73%).
- Analysis: ES is currently the primary battleground between "dip buyers" and "geopolitical realists." The 20d SMA (7659.11) is now acting as immediate overhead resistance. The lack of options data suggests that market makers are currently "dark" on positioning, increasing the likelihood of high-volatility, low-liquidity swings.
- Risk: The primary risk is a breach of the 7600 level, which would likely trigger a wave of systematic selling.
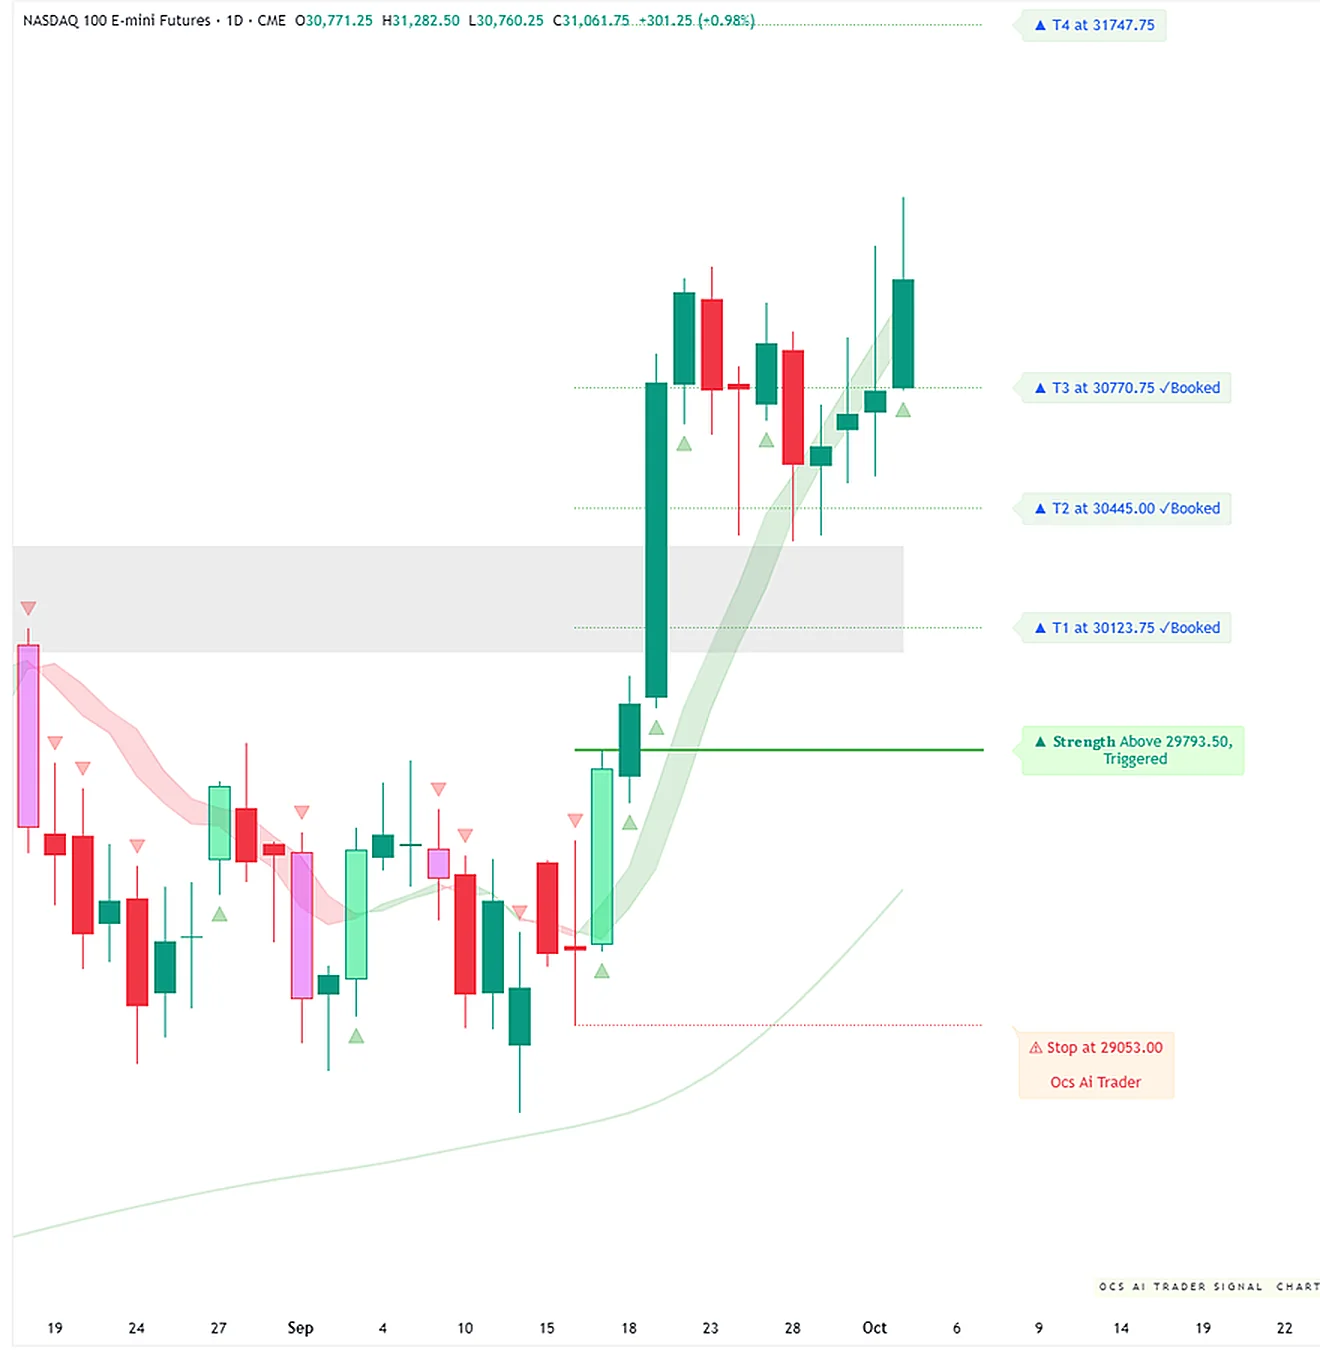
Nasdaq-100 Futures (NQ)
- Snapshot: Trading at 28256.75 (-4.62%).
- Analysis: NQ is suffering the most from the "input cost" and "valuation headwind" narrative. The MACD histogram at -96.05 indicates strong downward momentum. This is not just a tech sell-off; it is a fundamental re-rating of AI-infrastructure-heavy tech in the face of rising operational costs.
- Risk: Watch the 28000 level. A break here would confirm the breakdown of the short-term trend.
Russell 2000 Futures (RTY)
- Snapshot: Trading at 2849.20 (-6.14%).
- Analysis: RTY is the canary in the coal mine for economic sensitivity. With a 6% drop, it is clear that smaller, domestically-focused firms are being hit hardest by the energy-induced margin compression.
- Risk: RTY is currently testing the lower bounds of its recent range. Any further escalation in energy prices will likely lead to an aggressive rotation out of small-cap beta.
WTI Crude (CL)
- Snapshot: Trading at 86.24 (+3.65%).
- Analysis: CL is the beneficiary of the current chaos. The jump in price is a direct reflection of the "risk premium" being priced back into the term structure. We are seeing a shift from a contango-leaning market to a more volatile, event-driven structure.
- Risk: The risk is a sudden "peace premium" reversal. However, given the near-daily nature of the Houthi attacks, the market is likely to maintain this elevated floor.
Natural Gas (NG)
- Snapshot: Trading at 3.26 (+17.67%).
- Analysis: NG is the "sleeper" asset here. Its massive 17.67% jump suggests that the market is beginning to price in the potential for energy-substitution effects. If oil supplies are threatened, the market is betting on a rapid shift toward gas, which is driving this aggressive speculative move.
Historical Parallels
The current environment bears a striking resemblance to the September 2019 Abqaiq–Khurais attack. In that instance, a drone attack on Saudi infrastructure caused a 15% spike in oil prices overnight. The key difference today is the "near-daily" frequency of the current Houthi strikes. Unlike the 2019 "one-off" shock, the current market is dealing with a "persistent attrition" risk model. Historical data from 2019 suggests that volatility-linked assets (VXX) tend to peak 3-5 days after the initial shock, while equity markets often take 2 weeks to find a bottom as the "inflationary" impact of the energy price hike is priced into corporate earnings guidance.
Outlook & Risk Matrix
Short-Term (1-5 Days)
- Expectation: High volatility. The market will remain hyper-sensitive to any headline regarding the Strait of Hormuz or Saudi infrastructure.
- Key Levels: Watch ES 7600 and CL 86.00.
- Scenario: If the Houthi attacks continue, expect a further drain in equity liquidity as institutional desks move to cash.
Medium-Term (1-4 Weeks)
- Expectation: Structural re-rating. We anticipate that the "energy risk premium" will become a permanent feature of the market landscape for the remainder of Q4.
- Key Themes: Look for a continued rotation out of XLY/XLI and into XLE. Watch the USDINR exchange rate as a proxy for EM-liquidity stress.
What to Watch
- Energy Term Structure: Watch for the spread between spot and forward oil contracts. If the curve shifts into steeper backwardation, it signals that the market views the supply threat as immediate and severe.
- RBI Intervention: Monitor Indian Rupee liquidity. If the RBI accelerates foreign exchange selling to defend the Rupee, it will be a clear signal that the "Energy-Dollar-India" feedback loop is reaching a breaking point.
- Houthi Headline Flow: The frequency of attacks is the primary variable. A decrease in frequency will likely trigger a sharp, but potentially temporary, equity rally. An increase in frequency will force a deeper re-evaluation of global growth projections.
Education and market research only, not financial advice. Charts are OCS AI Trader readings at the time of writing and change with new bars.