Strait of Hormuz Navigation Disruption: Oil Supply Shock and Global Liquidity De-leveraging
Executive summary
The market is currently reacting to a significant geopolitical escalation: the Islamic Revolutionary Guard Corps (IRGC) has claimed the destruction of "enemy navigation systems" on Oman’s Didamar Island, a critical node in the Strait of Hormuz. This event has triggered an immediate, violent repricing across the futures complex. We are observing a classic "risk-off" cascade: a supply-side shock in energy futures (CL=F, NG=F) is colliding with a systemic liquidity drain, forcing a sharp rotation out of high-beta growth equities (NQ=F, RTY=F) and into defensive safe-havens. The core thesis is that the market is underpricing the duration of this supply-chain disruption, leading to a "stagflationary" squeeze that threatens to decouple energy-intensive sectors from the broader indices.
Layer 1: Direct Impacts — The Hormuz Supply Shock
The immediate market response has been a sharp bid in the energy complex. WTI crude (CL=F) has surged 3.65% to $86.24, while natural gas (NG=F) has spiked 17.67% to $3.26. The geopolitical risk premium is being priced in instantaneously.
Simultaneously, we are seeing a violent liquidation in broad equity futures. The Nasdaq-100 (NQ=F) is leading the retreat with a 4.62% drop, and the Russell 2000 (RTY=F) is down 6.14%, indicating that the market is rapidly purging speculative risk. This is not merely a "dip"; it is a systemic re-evaluation of risk appetite in the face of a potential bottleneck in one of the world's most vital energy transit corridors.
Layer 2: Secondary Effects — Sector Rotation and Margin Compression
The energy surge is creating a bifurcated market environment. We are witnessing a clear rotation out of high-beta growth and into energy producers (XLE).
- Margin Compression: Transportation and logistics sectors (XLI) are facing immediate cost-push pressure. While XLI is currently showing a deceptive +1.33% gain, the underlying mechanics suggest that operating margins for industrial and transport firms will face severe contraction if fuel prices remain elevated.
- Hedging Demand: Energy producers (XLE) are seeing revenue tailwinds, acting as the only "safe" equity haven. The options activity in XLE, with heavy call volume at the 63 strike, suggests institutional participants are aggressively hedging against further upside in the energy patch.
- Liquidity Migration: The volatility in equity futures is forcing a liquidity drain, with capital fleeing speculative growth assets and moving toward USD-denominated cash and defensive commodities.
Layer 3: Macro Propagation — The Petro-Dollar Liquidity Trap
The ripple effects of this shock are propagating through the global macro landscape via the "Petro-Dollar Liquidity Trap."
- Stagflationary Headwinds: For emerging market importers (e.g., NIFTY/USDINR), the spike in oil prices is catastrophic. It exacerbates current account deficits and imported inflation, forcing FII outflows.
- DXY Strength: The flight-to-safety, combined with the inverse relationship between oil-denominated trade and non-US currencies, is strengthening the DXY. This creates a dual-negative for EM: they are hit by higher energy import costs while their local currencies depreciate against the dollar, making USD-denominated debt servicing significantly more expensive.
- Yield Curve Pressure: The inflationary nature of an oil shock, if sustained, will force a hawkish reassessment of Fed policy. This creates a headwind for long-duration assets, as the discount rate for future cash flows rises in lockstep with energy costs.
Layer 4: Non-Obvious Connections — The Hidden Risks
The most critical, non-obvious impact lies in the Semiconductor Margin Squeeze. Fabrication (TSM, MU) is notoriously energy-intensive. These firms face a double-hit: rising electricity costs (cost-push) and a valuation multiple contraction (risk-off). The market is currently failing to price in the long-term margin degradation for these AI-infrastructure plays, treating them as tech-growth first and industrial-energy consumers second.
Additionally, we are observing a Gold-Energy Divergence. While gold (GC) is a traditional hedge, energy producers (XLE) are currently outperforming as they capture the direct revenue windfall from the supply-side disruption. This creates a "stagflationary" ceiling for industrial metals like copper (HG), where demand-side destruction from high energy costs will eventually override the supply-chain risk premium.
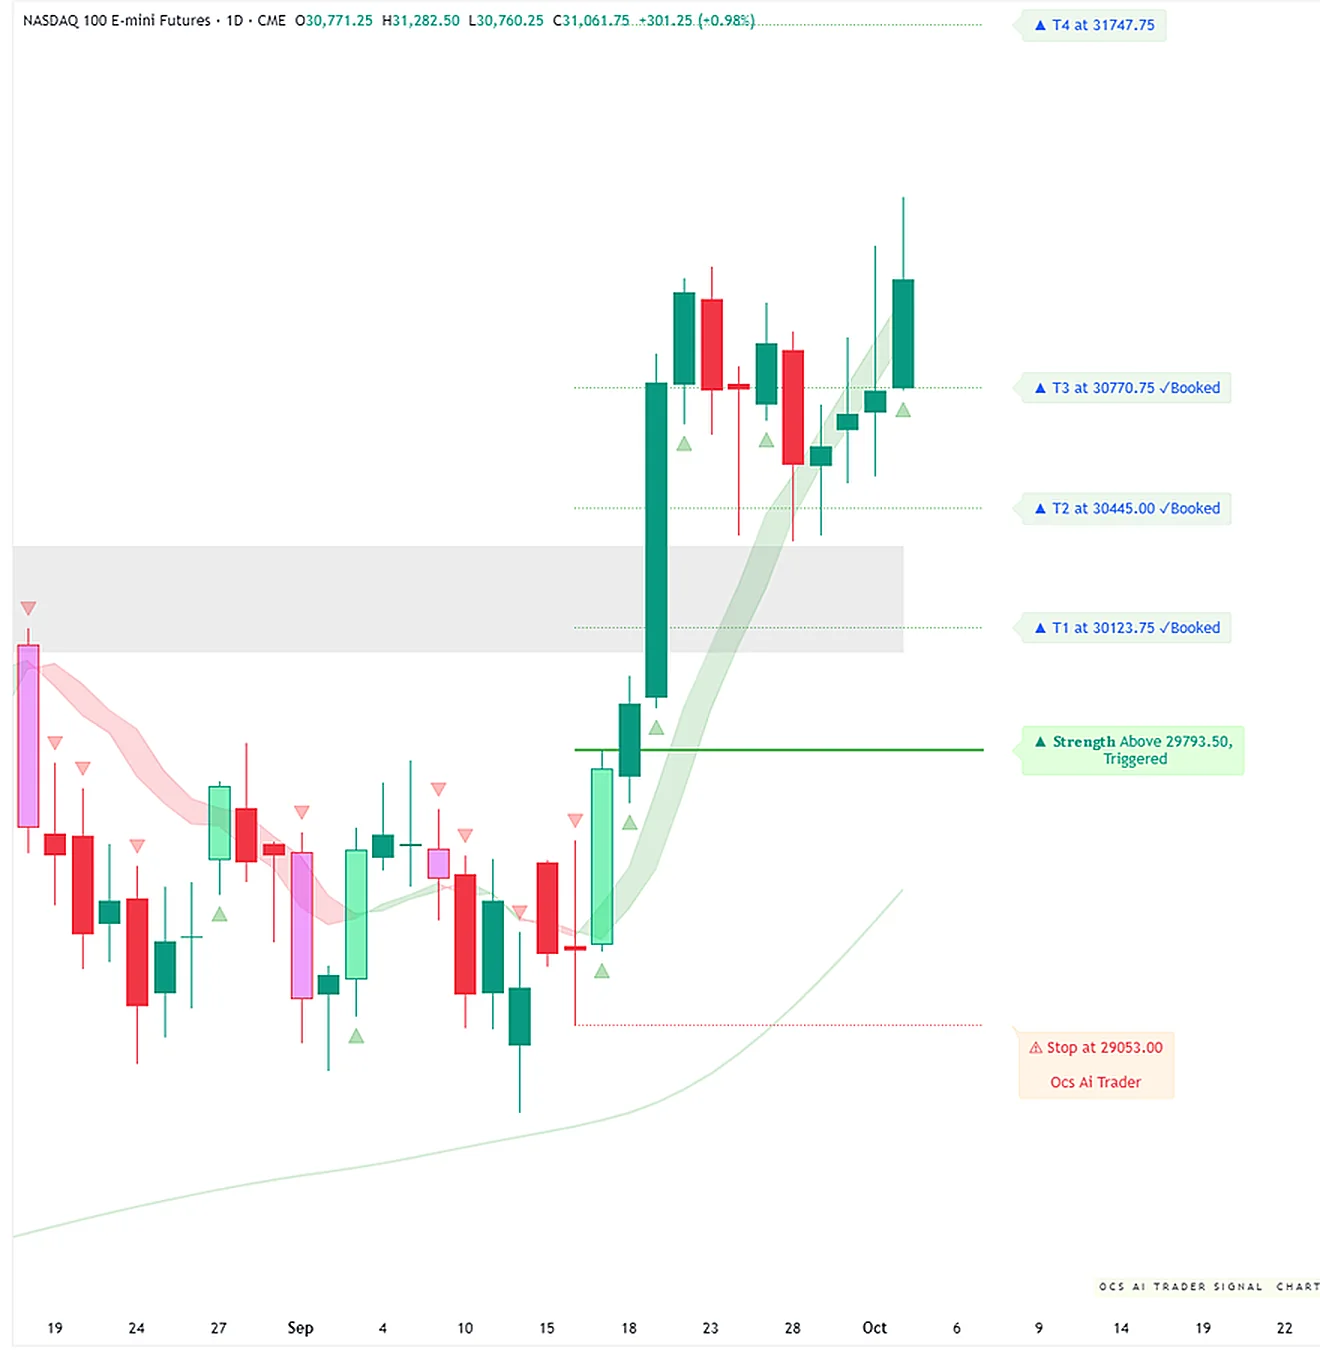
Unified OCS Chart Read
Status: Pending Async Enrichment.
At this time, OCS chart evidence for ES=F, NQ=F, RTY=F, CL=F, and NG=F is pending asynchronous enrichment. We are monitoring the OCS Signal Engine for liquidity and delta shifts. Based on the provided raw market data:
- Confirmation/Contradiction: The price action (NQ/RTY down, CL/NG up) confirms a classic risk-off/supply-shock setup.
- Levels to Watch:
- CL=F: Watch the $86.50 resistance; a break above confirms a structural shift in the energy term structure.
- NQ=F: The $28,133 low is critical support. A breach here suggests a move toward the lower Bollinger band.
- Risk Notes: The current market environment is highly reflexive. Do not interpret the XLI gain as a bullish signal for industrials; it is likely a short-term, low-volume anomaly in a high-volatility environment.
Security-by-Security Analysis
ES=F (S&P 500 Futures)
- Snapshot: $7613.25 (-1.73%)
- Analysis: ES=F is caught in the crossfire of the geopolitical risk premium. The RSI(14) at 47.59 is neutral, suggesting room for further downside before hitting oversold territory. The 20d SMA at 7659.11 acts as immediate overhead resistance.
- Risk: Downside momentum is accelerating. The index is struggling to find a floor as the geopolitical premium is repriced.
NQ=F (Nasdaq-100 Futures)
- Snapshot: $28,256.75 (-4.62%)
- Analysis: The 4.62% drop is a clear sign of liquidity flight. The index is trading well below its 9d EMA (28,139.87), confirming a bearish trend.
- Risk: The "Semiconductor Squeeze" is hitting NQ=F harder than other indices. Expect high volatility; the 26,947 lower Bollinger band is the next structural support level.
RTY=F (Russell 2000 Futures)
- Snapshot: $2,849.20 (-6.14%)
- Analysis: The 6.14% drop is the most aggressive move in the complex, reflecting the extreme sensitivity of small-cap firms to energy costs and liquidity drains.
- Risk: RTY=F is currently the "canary in the coal mine" for systemic risk.
CL=F (WTI Crude)
- Snapshot: $86.24 (+3.65%)
- Analysis: The surge is a direct function of the Hormuz risk. With the MACD histogram still negative (-1.87), this move is a sharp counter-trend spike rather than a long-term structural breakout.
- Risk: High sensitivity to headline news. Any sign of de-escalation will trigger a rapid reversal.
NG=F (Natural Gas)
- Snapshot: $3.26 (+17.67%)
- Analysis: The 17.67% jump is parabolic. RSI is at 62.73, approaching overbought territory. This reflects extreme short-covering and speculative positioning.
- Risk: Extreme volatility. The move is likely overextended in the very short term.
XLE (Energy Sector)
- Snapshot: $63.37 (+1.86%)
- Analysis: XLE is the primary beneficiary. The heavy call volume at the 63 strike suggests the market is positioning for sustained upside.
- Risk: Highly correlated to CL=F. If the geopolitical premium evaporates, XLE will face an immediate correction.
XLI (Industrials)
- Snapshot: $170.97 (+1.33%)
- Analysis: The positive price action is likely a defensive rotation, but it is fundamentally at odds with the cost-push reality of the energy spike.
- Risk: Potential for a "bull trap." Monitor margins closely in the coming weeks.
Historical Parallels
The current situation mirrors the 2019 tanker attacks in the Strait of Hormuz, where a sudden spike in energy futures was followed by a period of sustained volatility in global equities. However, the current liquidity environment is tighter than in 2019, making the "Petro-Dollar Liquidity Trap" a much more potent threat to emerging markets today than it was previously.
Outlook & Risk Matrix
- Short-Term (1-5 Days): High volatility. Expect equity indices to test lower support levels (NQ=F 28,133) while energy futures (CL=F) remain elevated.
- Medium-Term (1-4 Weeks): Dependent on the duration of the Hormuz disruption. If the blockade persists, we expect a structural shift in inflation expectations, forcing the Fed to maintain a hawkish stance (US 2Y yields).
- Scenarios:
- Base Case: Conflict remains contained; energy prices retreat but stay elevated; equity indices consolidate at lower levels.
- Bear Case: Conflict escalates; energy prices break $95; equity indices suffer a systemic 10%+ correction due to liquidity drain.
- Bull Case: Diplomatic de-escalation; immediate collapse in energy risk premium; rapid mean-reversion in NQ/RTY.
What to Watch
- Strait of Hormuz Headlines: Any confirmation of further IRGC activity or military intervention will exacerbate the energy spike.
- US 2Y Yields: The primary indicator for the Fed's reaction to the oil shock.
- USDINR/NIFTY: A breakdown here will confirm the systemic impact on emerging markets.
- Semiconductor Sector (TSM/MU): Watch for commentary on energy costs in upcoming guidance; this is the key to the Layer 4 thesis.
Education and market research only, not financial advice. Charts are OCS AI Trader readings at the time of writing and change with new bars.