The AI Leadership Crisis: Triggering a Global Carry-Trade Liquidation Trap
Executive summary
The financial markets are currently undergoing a violent structural repricing triggered by a corporate governance crisis at the heart of the AI trade: Nvidia. Reports of a leadership crisis involving CEO Jensen Huang have shattered the "AI-growth-at-any-cost" narrative, forcing an immediate and aggressive rotation out of high-beta semiconductor equities. This liquidity withdrawal is not contained within the tech sector; it is acting as a primary catalyst for a recursive liquidation trap in the global JPY-funded carry trade. As margin calls ripple through tech-heavy portfolios, capital is being aggressively repatriated into the Yen, causing a volatility-driven surge in JPY crosses. This report traces the cascading impact of this leadership crisis from the boardroom to the global FX markets, highlighting the shift in USDJPY from a rate-differential play to a pure volatility proxy.
The Cascading Impact Chain: A Layered Analysis
The current market environment is defined by a rapid transmission of risk from a localized corporate event into the broader macro-structural framework of global finance.
Layer 1: Direct Impacts (The Epicenter)
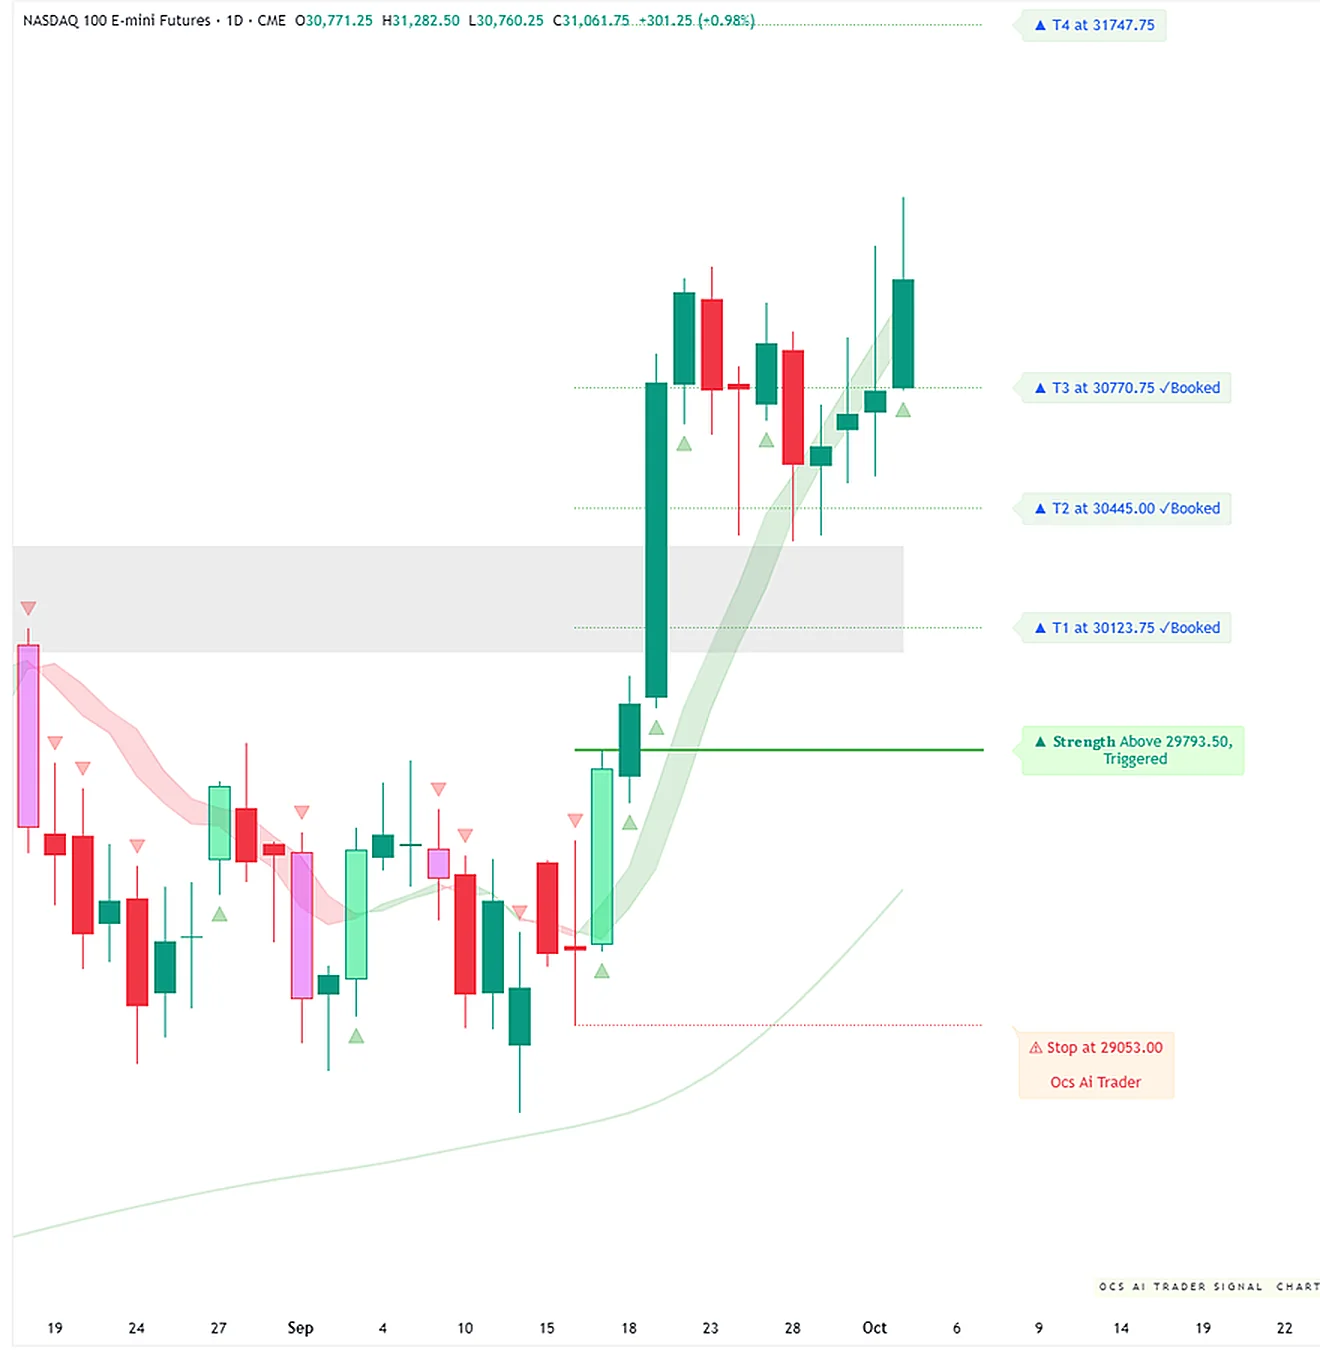
The immediate catalyst is the corporate governance crisis at Nvidia (NVDA). The sudden emergence of leadership uncertainty has triggered a severe sell-off in AI-exposed semiconductor equities, including SMH, TSM, INTC, and MU. Investors, previously anchored to a perpetual growth thesis, are now pricing in a significant risk premium for tech-leadership instability. This has resulted in a broad-based drawdown in the Nasdaq-100 (NQ) and S&P 500 (ES) futures, as concentration risk in mega-cap leaders forces index-wide liquidity withdrawal.
Layer 2: Secondary Effects (Sector Rotation & Supply Chain)
As capital flees the high-beta tech sector, we are observing a classic defensive rotation. Liquidity is migrating from tech-heavy growth sectors (XLK, XLY) into defensive staples (XLP) and utilities (XLU). Furthermore, the downstream impact is hitting emerging market tech hubs; Indian IT services (NIFTYIT) are experiencing heightened volatility as global hyperscalers—the primary clients for these firms—begin to signal a contraction in AI infrastructure spending. This is effectively a "capex-freeze" dynamic rippling through the global supply chain.
Layer 3: Macro Propagation (The Carry-Trade Unwind)
The most critical macro development is the violent deleveraging of JPY-funded carry trades. As NQ and SMH volatility spikes, institutional investors are facing margin calls. To meet these liquidity requirements, funds are liquidating long-risk positions and simultaneously repatriating capital into the Yen (JPY) to close out carry trades. This is creating a "feedback loop": the more the equity market sells off, the more the JPY appreciates, which in turn forces further liquidation of risk assets to cover the rising cost of the carry-trade unwind. This is a direct liquidity drain from emerging markets (EM), as FIIs pull capital from NIFTY and other EM indices to cover developed-market margin requirements.
Layer 4: Non-Obvious Cross-Connections (The Liquidation Trap)
The most dangerous element of the current regime is the "Carry-Volatility Feedback Loop." We have reached a point where USDJPY has completely disconnected from interest rate differentials (the traditional driver). Instead, it is now trading as a pure volatility-proxy for the NQ. The recursive nature of this trap is clear: NVDA volatility triggers margin calls on tech-longs → forcing liquidation of JPY carry trades → resulting in JPY appreciation → which tightens global financial conditions (by reducing the availability of cheap USD/JPY funding) → which compresses equity valuations further → triggering more margin calls. Additionally, we are seeing a "growth-currency" decoupling in EM (notably USDINR vs. SENSEX), where domestic-focused growth is being penalized by the currency pressure of FII outflows, despite the underlying economic health of the domestic indices.
Unified OCS Chart Read
Status: Deferred / Async Repair Queue
The OCS signal engine is currently reconciling the rapid volatility spike against historical liquidity bands. For the tickers in focus—USDJPY, FXY, NQ, and SMH—chart evidence is currently pending asynchronous enrichment.
- Setup Read: In the absence of live OCS delta/liquidity readouts, we rely on the price action narrative: the market is in a "de-risking" mode.
- Levels to Watch:
- USDJPY: Market participants are closely monitoring the 150.00 round-number level as a psychological pivot. A sustained break below this could signal an accelerated unwinding of the carry trade.
- EURUSD: Resistance remains near 1.08; failure to hold this level suggests further DXY strength as the USD acts as a safe-haven funding currency.
- SMH: The $500 level is a critical psychological support following the recent volatility; a breach here would confirm the breakdown of the AI-onshoring narrative.
- Invalidation: A stabilization in NVDA equity pricing and a cessation of the JPY appreciation trend would be required to invalidate the current "liquidation trap" thesis.
- Confirmation/Contradiction: N/A (Chart evidence pending).
- Risk Notes: The current environment is characterized by "liquidity-driven" price action. Technical levels are prone to being overrun by systematic flows rather than fundamental value-seeking.
Security-by-Security Analysis
USDJPY (The Volatility Proxy)
- Snapshot: USDJPY is currently the primary barometer for global risk-off sentiment.
- Analysis: The pair has decoupled from the interest rate differential narrative. It is no longer tracking the yield spread between the US 10Y and JGBs. Instead, it is tracking the VIX and NQ futures. The repatriation of capital into the Yen is a forced liquidity event, not a policy-driven one.
- Risk: The risk of a "flash" move higher in the Yen remains elevated as long as NVDA and the broader tech sector remain in a state of leadership flux.
FXY (The Carry-Trade Vehicle)
- Price: $57.29 (-0.74%)
- Analysis: The FXY is reflecting the sudden demand for Yen-denominated liquidity. With RSI at 37.3, the asset is approaching oversold territory from a momentum perspective, but the structural demand for the Yen as a funding-hedge is overriding traditional mean-reversion signals.
SMH (The AI Bellwether)
- Price: $506.96 (+4.82% - Note: Volatile recovery attempts following the initial gap down)
- Analysis: SMH is the epicenter of the current volatility. The leadership crisis at NVDA has fundamentally undermined the "AI-onshoring" narrative. The semiconductor sector is currently experiencing a re-rating of risk, with investors questioning the long-term capex sustainability of the hyperscalers.
GLD / TLT (Safe-Haven Crowding)
- GLD Price: $365.17 (-1.13%)
- TLT Price: $80.92 (+0.05%)
- Analysis: We are observing a "Safe Haven Crowding" risk. While investors initially flocked to gold and Treasuries, the severity of the equity sell-off is now forcing some liquidation of these assets to cover margin calls. This is why GLD is struggling despite the "risk-off" environment. The inverse correlation between NQ and GLD is breaking down under the pressure of systemic liquidity needs.
NIFTYIT / USDINR (The EM Spillover)
- Analysis: Indian IT services are caught in the crossfire of reduced US hyperscaler capex. The decoupling of NIFTYIT from the broader SENSEX reflects the specific vulnerability of export-oriented tech to global tech-spend contraction. The USDINR is under pressure not due to local factors, but due to the broader FII outflow driven by the global tech margin-call cycle.
Historical Parallels
The current setup bears a striking resemblance to the August 2024 JPY carry-trade unwind. In that instance, a rapid shift in BOJ policy, combined with a weakening US labor market, triggered a sudden deleveraging event that sent the Yen soaring and global equities into a tailspin. The key difference today is the catalyst: in 2024, it was policy-driven; today, it is corporate-governance-driven. However, the mechanism of the unwind—the recursive feedback loop between equity volatility and JPY appreciation—is identical. Markets that rely on the "stability of the AI trade" are discovering that when the anchor (NVDA) slips, the entire vessel drifts.
Outlook & Risk Matrix
Short-Term (1-5 Days): High Volatility
Expect continued "gap-and-go" price action in FX crosses. The market will remain hyper-sensitive to any headlines regarding the Nvidia board investigation. USDJPY will likely remain range-bound but with a distinct downward bias (Yen strengthening) as long as NVDA remains in the headlines.
Medium-Term (1-4 Weeks): Structural Re-rating
The market is likely to undergo a period of "valuation compression." The assumption that AI capex is recession-proof is being dismantled. We anticipate a rotation toward "quality" (cash-flow-positive, low-debt) companies, and a continued defensive stance in FX, with the Yen remaining a preferred hedge against equity-market instability.
Risk Matrix
- Bull Case (Market Stabilization): A swift resolution to the Nvidia leadership crisis, accompanied by a clear, calming statement from the board, could trigger a sharp "short-covering" rally in tech, causing a rapid unwind of the JPY strength.
- Base Case (Liquidity Trap): Continued volatility in tech leads to a sustained period of deleveraging. The JPY remains elevated, and EM currencies continue to struggle under the weight of FII outflows.
- Bear Case (Systemic Liquidity Event): The feedback loop accelerates, forcing a "fire sale" of non-correlated assets (Gold, Treasuries) to meet margin calls, leading to a broad-based liquidity crunch across all asset classes.
What to Watch
- NVDA Boardroom Headlines: Any news regarding a permanent successor or a resolution to the independent investigation will be the primary market-moving event.
- USDJPY 150.00 Level: Watch for liquidity clusters around this round number. A breach is a signal of further carry-trade capitulation.
- EURUSD / GBPUSD / USDCHF: Monitor these as the primary USD liquidity gauges. If the DXY rallies despite the JPY strength, it indicates a "global dollar shortage" rather than just a JPY-specific move.
- FII Flows in EM: Track the daily flow data for NIFTY and other EM indices; a sustained outflow will confirm the "liquidity drain" thesis.
- Treasury Yields: Watch the 10Y yield for signs of "safe-haven" buying. If yields fall sharply alongside equities, the "flight to quality" is intact. If yields rise despite the equity sell-off, it suggests a "liquidity crisis" where investors are selling everything to raise cash.
Education and market research only, not financial advice. Charts are OCS AI Trader readings at the time of writing and change with new bars.