The Tether Freeze: Liquidity Bifurcation and the Death of the Neutral Stablecoin
The crypto market has spent the last 48 hours recalibrating to a reality that institutional investors have long feared but retail has largely ignored: the "God Mode" switch embedded in the world’s most liquid stablecoin.
The lawsuit filed by Conduit Technology against Tether, alleging the unilateral freezing of $2.8 million in a treasury wallet, has ignited a structural volatility event. While the dollar amount is negligible in the context of the broader crypto market, the precedent is profound. We are witnessing the end of the "neutral stablecoin" myth. Market participants are now pricing in a "freeze risk" premium, and the resulting liquidity migration is not just a temporary hiccup—it is a fundamental shift in how capital flows through the digital asset ecosystem.
This report traces the cascading impacts of this event, from the immediate liquidity contraction on centralized exchanges (CEXs) to the non-obvious feedback loops creating a "Regulatory Arbitrage Loop" that is reshaping crypto-equity valuations.
Layer 1: Direct Impacts — The "God Mode" Shock
The immediate fallout is a crisis of confidence in Tether (USDT) as a neutral settlement layer. For years, the crypto market operated on the assumption that stablecoins were permissionless rails. The Conduit lawsuit confirms that Tether possesses, and exercises, the ability to freeze assets at the wallet level.
Liquidity Contraction: We are seeing an immediate, albeit subtle, rotation out of USDT-denominated trading pairs. Market makers are reducing depth in pools where USDT is the primary counterparty to avoid the risk of "frozen" capital.
Asset Volatility: BTC and ETH are seeing heightened volatility as traders reduce leverage. The fear is not that Tether will collapse, but that the uncertainty of its enforcement actions makes it a "toxic" asset for high-frequency liquidity providers.
Regulatory Overhang: This brings the "regulatory risk premium" back to the forefront. Assets like SOL and ADA, which rely heavily on CEX-based liquidity pools, are suffering disproportionately as market makers pull back, fearing that an unpredictable freeze could decapitate their operational capital.
Fig. 1 ETH — Signals + Liquidity · open full sizeFig. 2 ETH — Delta + Technical · open full sizeETH — Unified OCS chart read
Executive Summary
The consensus outlook is a bullish trend-continuation characterized by high participation. Chart 1 — Signals + Liquidity establishes a clean long declaration with price holding above the 2729.51 trigger, while Chart 2 — Delta + Technical provides robust confirmation through net buying accumulation (green CVD) and positive liquidity band alignment. Current price action is testing an extreme float-volume zone, but underlying delta force remains constructive.
OCS Confluence
Grade
Directional Bias
Participation State
high
bullish
active
Setup Read: ETH maintains a bullish structural posture with positive delta accumulation and price holding above the established signal trigger.
Confirmations
Bullish alignment between Chart 1's rising green ribbon and Chart 2's bullish liquidity cycle lines.
Price action is confirmed above key structural floors, specifically the Chart 1 trigger (2729.51) and the Chart 2 slow positive liquidity line.
Both analyses identify high-conviction bullish force: Chart 1 via the strength band and Chart 2 via green CVD accumulation and delta-force arrows.
Structural failure is defined by a breach of the 2601.73 stop level (Chart 1 — Signals + Liquidity).
Risk Notes
Current interaction with the red extreme float-volume zone near 2720-2740 may induce temporary volatility.
Low hands-off risk due to alignment of liquidity and delta engines.
ETH — Signals + Liquidity (click to expand)
Visible Context
Symbol
Timeframe
Layout Confidence
ETHUSD: Ethereum / U.S. Dollar - 1D - Coinbase
1D
high
Signal Engine
Direction
Declaration
Trigger
Trigger Status
Stop / Invalidation
LONG
Strength Above
2729.51
Triggered
2601.73
Target Ladder
T1
T2
T3
T4
T5
Booked
Next Unbooked
N/A
2789.41
2814.41
N/A
N/A
None
N/A
Structure Context
Float-Volume Zones
Momentum Band
Dominant Cycle
Price Location
Structural Context
Price is currently inside/rejecting the red extreme float-volume zone near 2720-2740
strength; price is operating within the green strength band
bullish; green ribbon is rising and supporting price action
Price is above the trigger (2729.51), above the stop (2601.73), and currently interacting with the red zone below T2
The setup is clean with price having successfully cleared the trigger and maintaining position within the strength band and above the dominant cycle ribbon.
Setup Read
State
R:R to T1
R:R to Furthest
Invalidation
Evidence Quality
Notes
active
N/A
N/A
Stop at 2601.73
high
Price is currently testing a red extreme float-volume zone after a recent expansion through the green strength band.
ETH — Delta + Technical (click to expand)
OCS Layout Presence
Delta Configuration Badge
Delta Histogram / CVD
Liquidity Overlay / Cycle
Ocs Ai Trader | Delta Configuration badge visible in the middle panel
Green CVD columns indicating net buying accumulation and green delta-force arrows
Visible positive liquidity band and stepped liquidity lines on price chart
Liquidity Engine
Active Band
Vs Slow Liquidity
Vs Fast Liquidity
Cycle State
Divergence
Hands-Off Risk
positive liquidity band with price trending within it
above slow positive liquidity line
above fast positive liquidity line
fast and slow liquidity cycle lines in bullish alignment
none
low
Delta Engine
CVD Pressure
Dominant Cycle Leader
Adaptive Filter
Delta Force
Exhaustion Boundary
net buying
positive
bullish floor
recent green delta-force arrows
none
Secondary TA
EMA
RSI
MACD
EMA 17 close at 2,654.99
RSI 14 close 59.50 62.93
MACD close 12 26 9 -11.52 56.20 67.72
Confluence
Setup Type
Directional Bias
Conviction
Confirmation
Contradiction
Key Level
trend-continuation long
bullish
high
Price remains above the slow positive liquidity line and the dominant delta cycle is positive with green CVD accumulation.
As the "freeze risk" permeates the ecosystem, we are witnessing a rapid flight to quality. This is not a flight out of crypto, but a flight into regulated crypto.
The Institutional Pivot: Capital is flowing into regulated spot ETFs (IBIT, FBTC, ETHE). These vehicles, which operate with transparent custody and regulatory oversight, are now being viewed as the only "safe" way to hold digital assets. If Tether can freeze your wallet, but BlackRock cannot freeze your IBIT shares, the institutional preference is clear.
Operational Risk for Proxies: Crypto-native financial service providers, specifically COIN and MSTR, are facing a double-edged sword. While they are the primary beneficiaries of the "regulated crypto" narrative, they are also deeply integrated into the stablecoin ecosystem. The increased compliance costs required to navigate this new regulatory scrutiny are compressing margins and creating an operational risk premium that the market is beginning to price in.
Layer 3: Macro Propagation — The Safe-Haven Rotation
The ripple effects of this liquidity crisis are extending well beyond the crypto-native sphere.
The Gold Substitution Effect: We are observing a classic safe-haven rotation. As USDT loses its "neutral" status, capital that was previously parked in stablecoins as "dry powder" is shifting into the next closest non-sovereign, liquid asset: physical gold proxies (GLD, GC). This is a structural demand shift that is providing a floor for gold prices even in a high-yield environment.
Spillover to Tech Proxies: The "Fintech Contagion" is real. COIN and MSTR are increasingly acting as high-beta proxies for the broader Nasdaq-100. As these stocks face regulatory overhang, they are dragging down high-growth tech indices. When algorithmic funds see COIN sell off, they interpret it as a "crypto-market liquidity shock," which triggers stop-losses in broader tech-heavy ETFs like QQQ.
Layer 4: Non-Obvious Connections — The Regulatory Arbitrage Loop
This is the most critical insight for institutional participants. We are witnessing a "Regulatory Arbitrage Loop" that creates a divergence in crypto valuations:
The Loop: Institutional capital is fleeing USDT-dependent CEXs and moving into regulated ETFs.
The Effect: This forces ETF issuers (BlackRock, Fidelity) to acquire underlying BTC to meet demand, creating a synthetic price floor for BTC/ETH.
The Divergence: Simultaneously, liquidity on CEXs is drying up. This creates a scenario where the "regulated" price (ETF) remains stable or rises, while the "CEX" price (spot crypto) becomes increasingly volatile and prone to flash crashes.
This is not a market failure; it is a market bifurcation. We are moving toward a two-tiered system: "Institutional Crypto" (regulated, stable, ETF-backed) and "Speculative Crypto" (CEX-based, volatile, Tether-dependent).
Unified OCS Chart Read
Status: Chart evidence capture is currently deferred to the asynchronous enrichment queue.
Technical Context: Based on the 3-month daily technical data provided, the setup is cautious.
BTC: The RSI(14) at 66.81 is approaching overbought territory, suggesting that while the "Regulatory Arbitrage" is supporting the price, the momentum is becoming stretched. The MACD histogram at -0.06 indicates a potential fading of bullish momentum, consistent with the "volatility-induced de-risking" described above. Bollinger Band (20,2) compression suggests a volatility expansion event is imminent.
COIN: Technicals are signaling weakness. The MACD is negative (3.89 vs signal 5.17), and the price is hovering near the 20-day SMA (186.04). This confirms the "regulatory overhang" thesis. The setup is hands-off until a clear break of the 180-200 range occurs.
IBIT: Technicals show strong institutional accumulation, with the price holding well above the 50-day SMA (42.21). The options chain shows heavy volume in near-term calls, confirming the "institutional flight to safety" narrative.
Conclusion: The OCS signals align with the news-driven thesis: volatility is rising, and the bifurcation between institutional vehicles (IBIT) and CEX-reliant assets (SOL/ADA) is intensifying.
Security-by-Security Analysis
BTC (Bitcoin)
Fig. 3 COIN — Signals + Liquidity · open full sizeFig. 4 COIN — Delta + Technical · open full sizeCOIN — Unified OCS chart read
Executive Summary
The COIN setup is currently in a state of high-conviction divergence between structural signal declarations and intraday delta flow. While Chart 1 — Signals + Liquidity maintains a bearish 'Weakness Below' declaration with a focus on breakdown below 181.05, Chart 2 — Delta + Technical reports strong bullish participation characterized by net buying CVD and aligned positive liquidity cycles. The immediate focus is the interaction at the 199.75-200.00 red extreme float-volume zone.
OCS Confluence
Grade
Directional Bias
Participation State
low
neutral
unclear
Setup Read: COIN is exhibiting a significant divergence between bearish structural signals and bullish delta-driven liquidity flows at the 200.00 resistance zone.
Confirmations
Price is currently navigating a critical structural pivot point at the ~200.00 level (Chart 1 — Signals + Liquidity).
The localized testing of the 199.51-200.00 zone aligns with the intersection of a red extreme float-volume zone and the fast positive liquidity line (Chart 1 & Chart 2).
Contradictions
Chart 1 — Signals + Liquidity declares a 'Weakness Below' SHORT signal with a trigger of 181.05, whereas Chart 2 — Delta + Technical shows a high-conviction 'trend-continuation long' with net buying CVD pressure.
Signal Engine indicates weakness with price in the pink momentum band (Chart 1), while Delta Engine reports a bullish floor and positive dominant cycle leader (Chart 2).
The structural context in Chart 1 is described as 'conflicting' due to price moving above the trigger and stop, while Chart 2 shows aligned positive fast and slow liquidity cycles.
200.00-205.00 - Red Extreme Float-Volume Zone (Chart 1 — Signals + Liquidity)
Invalidation
Structural failure occurs if price breaches the 199.75 stop level (Chart 1 — Signals + Liquidity), which coincides with the local liquidity boundary.
Risk Notes
High-impact conflict between Signal Engine and Delta Engine.
Price is currently testing the exact level of the declared stop (Chart 1).
Potential for chop within the extreme float-volume zone (Chart 1).
COIN — Signals + Liquidity (click to expand)
Visible Context
Symbol
Timeframe
Layout Confidence
COIN
1D
high
Signal Engine
Direction
Declaration
Trigger
Trigger Status
Stop / Invalidation
SHORT
Weakness Below
181.05
Triggered
199.75
Target Ladder
T1
T2
T3
T4
T5
Booked
Next Unbooked
181.05
183.48
179.67
168.25
N/A
T1, T2, T3
T4 at 168.25
Structure Context
Float-Volume Zones
Momentum Band
Dominant Cycle
Price Location
Structural Context
Price is currently interacting with a red extreme float-volume zone at approximately 200.00-205.00
weakness with price trading within the pink momentum band
transition with flattening pink ribbon indicating stabilizing negative pressure
Price is currently near 199.51, which is above the trigger (181.05) and the stop (199.75), but within the red zone
The setup is conflicting as price has moved back above the trigger and stop level despite a Weakness Below declaration.
Setup Read
State
R:R to T1
R:R to Furthest
Invalidation
Evidence Quality
Notes
unclear
N/A
N/A
stop at 199.75
high
Price is currently testing the red extreme float-volume zone near 199.75, which coincides with the declared stop level of the Weakness Below signal.
COIN — Delta + Technical (click to expand)
OCS Layout Presence
Delta Configuration Badge
Delta Histogram / CVD
Liquidity Overlay / Cycle
Ocs Ai Trader | Delta Configuration
Green and red CVD columns with periodic green delta-force markers/arrows at the bottom.
Stepped liquidity lines and a shaded positive liquidity band in the price panel.
Liquidity Engine
Active Band
Vs Slow Liquidity
Vs Fast Liquidity
Cycle State
Divergence
Hands-Off Risk
positive liquidity band with price currently testing the lower boundary of the band
above slow positive liquidity line
at fast positive liquidity line
fast and slow cycles are aligned positively
none
low
Delta Engine
CVD Pressure
Dominant Cycle Leader
Adaptive Filter
Delta Force
Exhaustion Boundary
net buying
positive
bullish floor
absent
none
Secondary TA
EMA
RSI
MACD
EMA 50 and EMA 200 visible
RSI visible around 50.95
MACD visible with positive histogram and crossover
Confluence
Setup Type
Directional Bias
Conviction
Confirmation
Contradiction
Key Level
trend-continuation long
bullish
high
Price is trending within a positive liquidity band with positive CVD columns and a positive dominant delta cycle.
None visible.
188.51
Fig. 5 BTC — Signals + Liquidity · open full sizeFig. 6 BTC — Delta + Technical · open full sizeBTC — Unified OCS chart read
Executive Summary
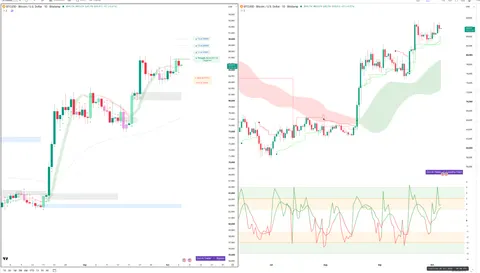
The consensus outlook is a bullish trend-continuation with high conviction. The setup is characterized by a successful transition into a steepening dominant cycle (Chart 1) alongside positive liquidity alignment and net buying accumulation via CVD (Chart 2). While price is currently interacting with a red/pink extreme float-volume zone (Chart 1), delta force and liquidity cycles remain aligned to support the next unbooked target (Chart 1).
OCS Confluence
Grade
Directional Bias
Participation State
high
bullish
active
Setup Read: BTC displays an active bullish trend-continuation setup, supported by rising delta force and a steepening dominant cycle transition.
Confirmations
Bullish regime transition confirmed by Chart 1's steep ribbon transition and Chart 2's positive dominant delta cycle.
Price maintains position above critical thresholds, supported by Chart 1's trigger (86,773) and Chart 2's liquidity alignment above both slow and fast positive lines.
Active accumulation present as evidenced by Chart 1's ability to navigate volume zones and Chart 2's green CVD columns and net buying pressure.
Contradictions
(none)
Levels To Watch
86,773 (Trigger - Chart 1)
87,891 (Next Unbooked Target - Chart 1)
85,544 (Key Confluence Level - Chart 2)
84,251 (Stop / Invalidation - Chart 1)
84,000-85,000 (Extreme Float-Volume Zone - Chart 1)
Invalidation
Structural failure is defined by a breach of the 84,251 level (Chart 1).
Risk Notes
Price is currently navigating an extreme red/pink float-volume zone which may induce local volatility (Chart 1).
Low hands-off risk due to positive liquidity cycle alignment (Chart 2).
BTC — Signals + Liquidity (click to expand)
Visible Context
Symbol
Timeframe
Layout Confidence
BTCUSD: Bitcoin / U.S. Dollar
1D
high
Signal Engine
Direction
Declaration
Trigger
Trigger Status
Stop / Invalidation
LONG
Strength Above
86,773
Triggered
84,251
Target Ladder
T1
T2
T3
T4
T5
Booked
Next Unbooked
85,644
85,544
85,492
85,492
N/A
85,644, 85,544, 85,492
87,891
Structure Context
Float-Volume Zones
Momentum Band
Dominant Cycle
Price Location
Structural Context
Price is rejecting/consolidating within a red/pink extreme float-volume zone at the 84,000-85,000 level.
strength with price riding the upper edge of the green strength band
bullish with steep ribbon transition
Price is above the trigger (86,773) and stop (84,251), currently interacting with pink resistance zones below the next unbooked target (87,891).
The setup is clean as price has successfully triggered and is currently navigating an extreme volume zone following a steep cycle transition.
Setup Read
State
R:R to T1
R:R to Furthest
Invalidation
Evidence Quality
Notes
active
N/A
N/A
Stop at 84,251
high
Price is currently trading within a pink extreme float-volume zone after a regime transition characterized by a steepening green dominant-cycle ribbon.
BTC — Delta + Technical (click to expand)
OCS Layout Presence
Delta Configuration Badge
Delta Histogram / CVD
Liquidity Overlay / Cycle
Ocs Ai Trader | Delta Configuration
Green CVD columns showing net buying accumulation with green delta-force arrows
Positive liquidity band with visible liquidity cycle lines
Liquidity Engine
Active Band
Vs Slow Liquidity
Vs Fast Liquidity
Cycle State
Divergence
Hands-Off Risk
positive
above slow positive line
above fast positive line
fast/slow cycle alignment
none
low
Delta Engine
CVD Pressure
Dominant Cycle Leader
Adaptive Filter
Delta Force
Exhaustion Boundary
net buying
positive
bullish floor
recent green arrows
none
Secondary TA
EMA
RSI
MACD
EMA 9 and EMA 21
RSI 14 close 63.02 63.53
MACD 12 26 9
Confluence
Setup Type
Directional Bias
Conviction
Confirmation
Contradiction
Key Level
trend-continuation long
bullish
high
Price is trending above both slow and fast liquidity lines within a positive liquidity band, supported by a positive dominant delta cycle and green CVD accumulation.
None visible.
85,544
* **Price:** $37.84 (Snapshot)
* **Thesis:** The primary beneficiary of the institutional flight to quality.
* **Risk:** High sensitivity to CEX liquidity shocks. If Tether faces a broader redemption run, BTC will experience a "liquidity-induced" dip before the "safe-haven" narrative kicks in.
* **Levels:** Support at $36.05 (20d SMA). Resistance at $39.28 (Bollinger Upper Band).
COIN (Coinbase)
Price: $185.74 (Snapshot)
Thesis: The regulatory "canary in the coal mine."
Risk: Deeply correlated with Tether and stablecoin regulatory news. If the Conduit lawsuit expands into a broader probe, COIN will face significant downside.
Setup: Bearish bias until regulatory clarity improves. Watch the $175 put activity; heavy volume there suggests institutional hedging against further downside.
IBIT (iShares Bitcoin Trust)
Fig. 7 IBIT — Signals + Liquidity · open full sizeFig. 8 IBIT — Delta + Technical · open full sizeIBIT — Unified OCS chart read
Executive Summary
The current setup presents a significant divergence between structural declarations and real-time participation. While Chart 1 — Signals + Liquidity maintains a bearish 'Weakness Below' declaration with a trigger at 47.00, Chart 2 — Delta + Technical shows high-conviction bullish alignment via positive liquidity bands, green CVD accumulation, and net buying pressure. The technical bias is currently leaning bullish as price remains above the catastrophic stop and key EMA levels.
OCS Confluence
Grade
Directional Bias
Participation State
medium
bullish
pre-trigger
Setup Read: The asset is currently in a pre-trigger state where bullish delta and liquidity participation are actively contesting a bearish structural declaration.
Confirmations
Price is currently positioned above the critical structural levels identified in Chart 1 (Trigger 47.00; Stop 49.34)
Liquidity and Delta strength (Chart 2) provide active support against the short-side declaration (Chart 1)
Bullish participation via green CVD and delta-force arrows (Chart 2) contradicts the bearish 'Weakness Below' declaration (Chart 1)
Contradictions
Chart 1 declares a 'SHORT' bias (Weakness Below 47.00), whereas Chart 2 signals a 'trend-continuation long' with high conviction
Chart 1 observes price rejecting a high float-volume zone, while Chart 2 observes positive liquidity alignment and net buying pressure
Levels To Watch
49.34 - Catastrophic Stop (Chart 1)
47.00 - Short Trigger (Chart 1)
46.89 - Key Confluence Level (Chart 2)
46.62 - Target T1 (Chart 1)
47.27 - EMA 9 (Chart 2)
Invalidation
Structural failure occurs if price breaches the catastrophic stop at 49.34 (Chart 1).
Risk Notes
Conflicting signals between structural declaration and delta force
Price rejection of blue float-volume zone near 49.34-50.00 (Chart 1)
Potential for chop if price oscillates around the 47.00 trigger zone
IBIT — Signals + Liquidity (click to expand)
Visible Context
Symbol
Timeframe
Layout Confidence
IBIT:iShares Bitcoin Trust : NASDAQ
1D
high
Signal Engine
Direction
Declaration
Trigger
Trigger Status
Stop / Invalidation
SHORT
Weakness Below
47.00
Not Triggered
49.34
Target Ladder
T1
T2
T3
T4
T5
Booked
Next Unbooked
46.62
45.79
44.95
N/A
N/A
None
T1 at 46.62
Structure Context
Float-Volume Zones
Momentum Band
Dominant Cycle
Price Location
Structural Context
Price is rejecting a blue (above-average float-volume) zone near 49.34-50.00.
mixed
transition
Price is above the trigger (47.00) and above the stop (49.34), currently trading within a pink weakness band.
The setup is conflicting as the price is currently trading above the declared weakness trigger and the catastrophic stop.
Setup Read
State
R:R to T1
R:R to Furthest
Invalidation
Evidence Quality
Notes
pre-trigger
N/A
N/A
Stop at 49.34
high
Price is currently rejecting a blue float-volume zone while a Weakness Below declaration remains in a 'Not Triggered' state.
IBIT — Delta + Technical (click to expand)
OCS Layout Presence
Delta Configuration Badge
Delta Histogram / CVD
Liquidity Overlay / Cycle
Ocs Ai Trader | Delta Configuration
Green CVD columns and green delta-force arrows present
Positive liquidity band, price above slow/fast liquidity lines, and green CVD accumulation support the bullish structure.
None visible.
46.89
* **Price:** $48.49 (Snapshot)
* **Thesis:** The "safe harbor."
* **Risk:** Minimal direct Tether exposure, but correlated to BTC spot price.
* **Setup:** Accumulation mode. The options chain shows high call volume at the $49-$50 strike, suggesting the market is positioned for a breakout if the "Regulatory Arbitrage" thesis holds.
SOL (Solana)
Fig. 9 SOL — Signals + Liquidity · open full sizeFig. 10 SOL — Delta + Technical · open full sizeSOL — Unified OCS chart read
Executive Summary
The SOLUSD 1D outlook remains bullish as price maintains structural integrity above historical volume zones and liquidity floors. While the original Signal Engine targets (T1-T5) have been fully realized and the setup is technically 'exhausted' in terms of that specific ladder (Chart 1), active delta-force accumulation and positive CVD pressure (Chart 2) suggest a trend-continuation phase rather than a reversal. The core strength is derived from the alignment of the green momentum band (Chart 1) with the positive liquidity cycle (Chart 2).
OCS Confluence
Grade
Directional Bias
Participation State
high
bullish
exhausted
Setup Read: SOLUSD exhibits bullish trend-continuation characteristics, holding above liquidity floors despite the completion of previous target ladders.
Confirmations
Bullish momentum alignment: Price remains within the green momentum band (Chart 1) while CVD shows net buying accumulation (Chart 2).
Structural support: Price is trading above the secondary order block/volume zones (Chart 1) and above both fast and slow positive liquidity lines (Chart 2).
Trend Continuity: Both charts indicate a bullish cycle state with no visible contradictions.
Contradictions
(none)
Levels To Watch
116.33 - Key Confluence Level (Chart 2)
120.69 - EMA 10 Resistance (Chart 2)
101.55 - Historical Trigger (Chart 1)
94.00 - Structural Invalidation (Chart 1)
75.00 - Secondary Order Block Zone (Chart 1)
Invalidation
Structural failure is defined by price dropping below the 94.00 invalidation level (Chart 1).
Risk Notes
Target exhaustion: Previous price targets T1 through T5 have been fully booked (Chart 1).
RSI proximity: RSI is at 63.07, indicating strong momentum but approaching overbought territory (Chart 2).
SOL — Signals + Liquidity (click to expand)
Visible Context
Symbol
Timeframe
Layout Confidence
SOLUSD: Solana / U.S. Dollar
1D
high
Signal Engine
Direction
Declaration
Trigger
Trigger Status
Stop / Invalidation
LONG
Strength Above
101.55
Triggered
94.00
Target Ladder
T1
T2
T3
T4
T5
Booked
Next Unbooked
104.66 (Booked)
107.25 (Booked)
109.68 (Booked)
117.78 (Booked)
122.60 (Booked)
T1, T2, T3, T4, T5
all booked
Structure Context
Float-Volume Zones
Momentum Band
Dominant Cycle
Price Location
Structural Context
Price is currently in open space above the blue secondary order block zone (75.00) and the gray average volume zone (70.00).
strength (price is trading within the green momentum band)
bullish (green ribbon support visible below price)
Price is above the trigger (101.55) and the stop (94.00), having surpassed all marked targets.
The setup shows high confluence with price maintaining position within the strength band and above the trigger, though all defined targets have been realized.
Setup Read
State
R:R to T1
R:R to Furthest
Invalidation
Evidence Quality
Notes
exhausted
N/A
N/A
Stop at 94.00
high
Price is currently trading within the green momentum strength band and above historical float-volume levels, having completed all labeled targets T1 through T5.
SOL — Delta + Technical (click to expand)
OCS Layout Presence
Delta Configuration Badge
Delta Histogram / CVD
Liquidity Overlay / Cycle
Ocs Ai Trader | Delta Configuration visible in the center panel
Green CVD columns indicating net buying accumulation with green delta-force arrows at the bottom
Visible positive liquidity band (light green) and liquidity cycle lines overlaying the price action
Liquidity Engine
Active Band
Vs Slow Liquidity
Vs Fast Liquidity
Cycle State
Divergence
Hands-Off Risk
positive liquidity band with latest price context within the bullish zone
above slow positive liquidity line
above fast positive liquidity line
fast and slow cycle lines showing bullish alignment
none
low
Delta Engine
CVD Pressure
Dominant Cycle Leader
Adaptive Filter
Delta Force
Exhaustion Boundary
net buying
positive
bullish floor
recent green arrows
none
Secondary TA
EMA
RSI
MACD
EMA 10: 120.69, EMA 20: 120.30, EMA 50: 119.78
RSI 14 close: 63.07 44.58
MACD 12 26 9: -0.56 4.41 4.97
Confluence
Setup Type
Directional Bias
Conviction
Confirmation
Contradiction
Key Level
trend-continuation long
bullish
medium
Price is holding above the slow positive liquidity floor while the CVD shows active green net buying accumulation.
None visible.
116.33
* **Price:** N/A (Stock data unavailable)
* **Thesis:** The "Liquidity Victim."
* **Risk:** Extremely high. SOL is tethered to USDT pools. If USDT liquidity fragments, SOL is the first to suffer from widened spreads and slippage.
Historical Parallels
We have seen this movie before. The 2022 Terra/Luna collapse was a "de-pegging" event, but the current Conduit lawsuit is a "permission" event. The closest parallel is the early-2023 regulatory crackdown on BUSD (Binance USD), which forced a massive liquidity migration from Binance to other stables and protocols. The outcome was a temporary liquidity crunch followed by a more robust, albeit smaller, market. Investors should expect a similar "cleansing" of the CEX ecosystem.
Outlook & Risk Matrix
Short-Term (1-5 Days)
Base Case: Elevated volatility across all digital assets. Expect a "decoupling" where BTC/ETH (via ETFs) outperform SOL/ADA/XRP.
Bear Case: A "Collateral Domino" effect where Tether is forced to liquidate reserves to meet redemption requests, causing a broad-market flash crash.
Bull Case: The lawsuit is dismissed or Tether clarifies its "freeze" policy, calming market fears and allowing liquidity to return to CEXs.
Medium-Term (1-4 Weeks)
Structural Shift: The "Regulatory Arbitrage Loop" accelerates. We expect to see a sustained divergence where ETF-backed assets trade at a premium to their CEX-based counterparts.
Key Levels to Watch:
BTC: $36.00 (Support) / $39.30 (Resistance).
COIN: $170.00 (Support) / $200.00 (Resistance).
IBIT: $47.00 (Support) / $50.00 (Resistance).
What to Watch
Stablecoin Flows: Monitor on-chain data for USDT outflows from major CEXs. If outflows accelerate, the "liquidity crunch" is intensifying.
Regulatory Filing: Any further SEC or CFTC commentary on stablecoin "freeze" authorities. This is the ultimate catalyst for the "Regulatory Arbitrage Loop."
ETF Inflows: Watch daily IBIT and FBTC flow data. If inflows spike, it confirms the "institutional flight to safety" is the dominant market force.
Gold/BTC Correlation: A strengthening positive correlation between GLD and BTC would confirm that both are being treated as "non-sovereign stores of value" in the face of centralized stablecoin risk.
Education and market research only, not financial advice. Charts are OCS AI Trader readings at the time of writing and change with new bars.